Week 9: Descriptive and comparative statistics
0.0(0)
Studied by 0 people Call Kai
 Learn
Learn Practice Test
 Spaced Repetition
 Match
Match Flashcards
 Knowt Play
Card Sorting
1/38

Earn XP
Description and Tags
Last updated 12:10 PM on 10/11/26
Name | Mastery | Learn | Test | Matching | Spaced | Call with Kai | Chat |
|---|
No analytics yet
Send a link to your students to track their progress
39 Terms
1
New cards
Biostatistics
The science of analyzing data and interpreting results so they can be applied to biology, health, environmental problems
2
New cards
Univariate analysis
one variable in a data set using simple statistics like counts (frequencies), proportions, and averages
3
New cards
Bivariable analysis
uses rate ratios, odds ratios, and other comparative statistical tests to examine the associations between two variables (mostly exposure and outcome)
4
New cards
Multivariable analysis
encompasses statistical tests such as multiple regression models that examine the relationships among three or more variable
5
New cards
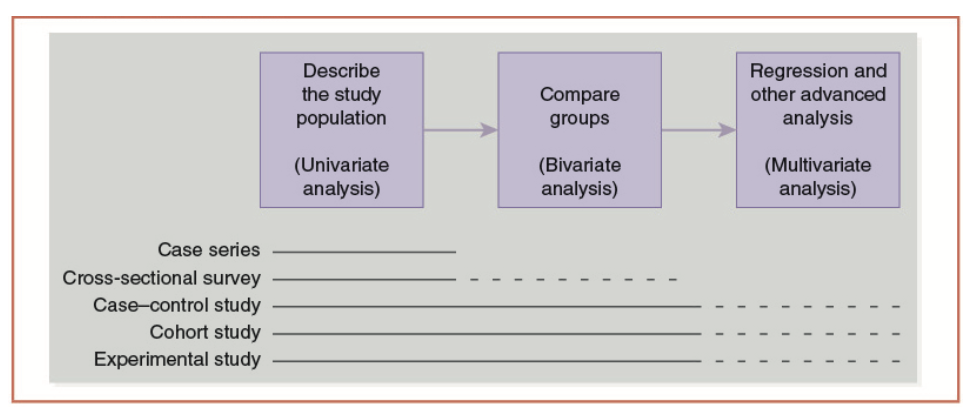
Describe the population study = ________ analysis
\
Compare groups = ________ analysis
\
Regression and other advanced analysis = ________ analysis
\
Compare groups = ________ analysis
\
Regression and other advanced analysis = ________ analysis
Univariate analysis
Bivariate analysis
Multivariate analysis
Bivariate analysis
Multivariate analysis
6
New cards
What is a variable?
- Any quantity that varies from one entity to another (sometime within an entity over time)
- Any attribute, phenomenon, or event that can have different values
- Any attribute, phenomenon, or event that can have different values
7
New cards
Qualitative variables
nominal
Ordinal
Ordinal
8
New cards
Quantitative variables
Discrete
Continuous
Internal
Ratio
Continuous
Internal
Ratio
9
New cards
Nominal Variables
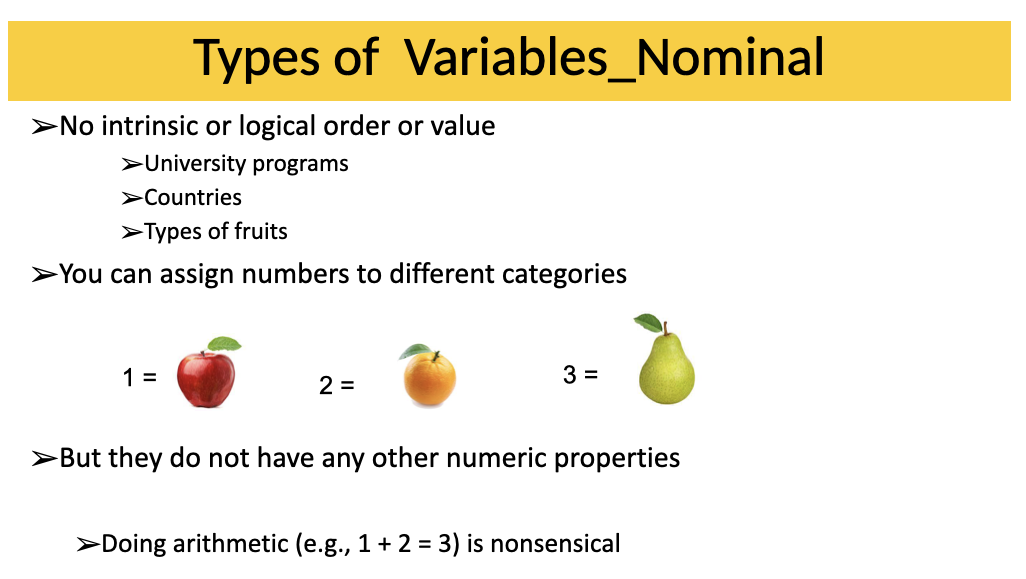
No intrinsic or logical order or value
eg,
- University programs
- Countries
- Types of fruits
numbers can be assigned to different categories
eg,
- University programs
- Countries
- Types of fruits
numbers can be assigned to different categories
10
New cards
Ordinal Variables
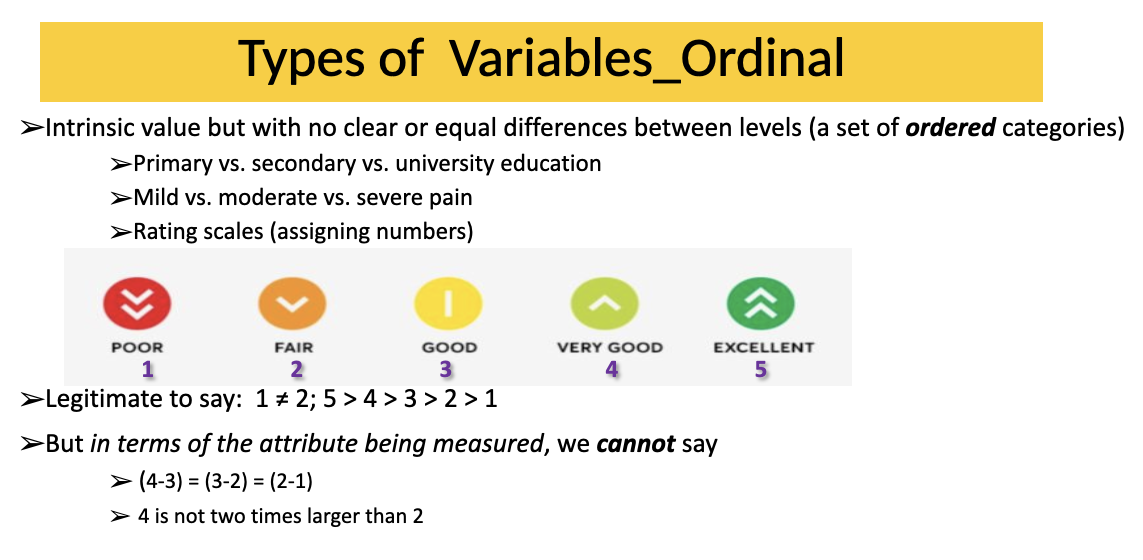
Intrinsic value but with no clear or equal differences between levels (a set of ordered categories)
eg,
- Primary vs. secondary vs. university education
- Mild vs. moderate vs. severe pain
- Rating scales (assigning numbers)
eg,
- Primary vs. secondary vs. university education
- Mild vs. moderate vs. severe pain
- Rating scales (assigning numbers)
11
New cards
How to display Qualitative data
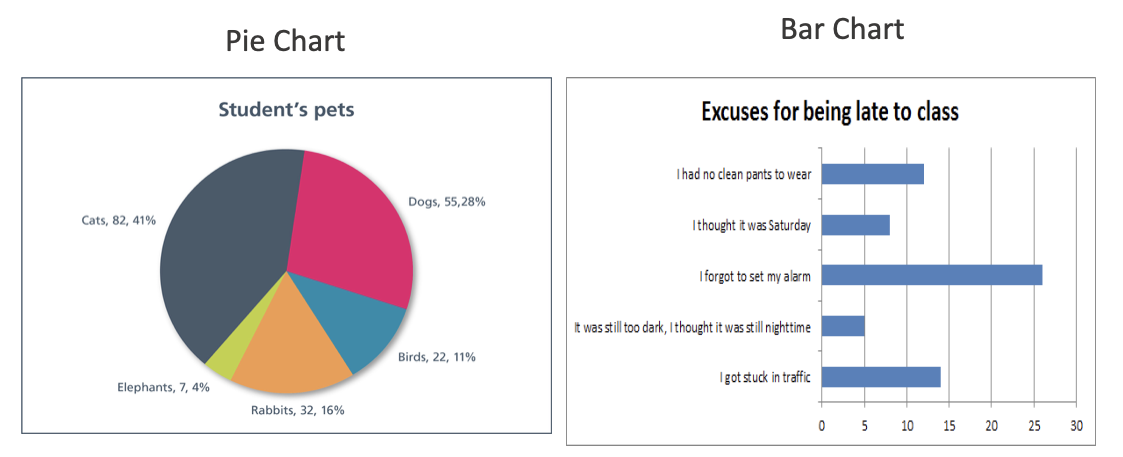
Pie Charts
Bar charts
Frequency tables
Bar charts
Frequency tables
12
New cards
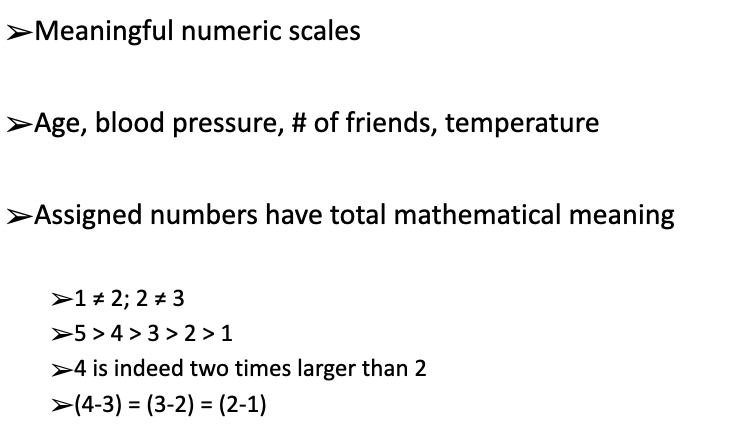
Numeric Variables
Meaningful numeric scales
Age, blood pressure, # of friends, temperature
Assigned numbers have total mathematical meaning
eg. Continuous and Discrete
Age, blood pressure, # of friends, temperature
Assigned numbers have total mathematical meaning
eg. Continuous and Discrete
13
New cards
Continuous Variables
- can take any value
- blood pressure
- temperature
- can be plotted as a line
- blood pressure
- temperature
- can be plotted as a line
14
New cards
Discrete Variables
Can take a finite or limited number of values
- age in year
- # of drinks
- can be plotted as dots
- age in year
- # of drinks
- can be plotted as dots
15
New cards
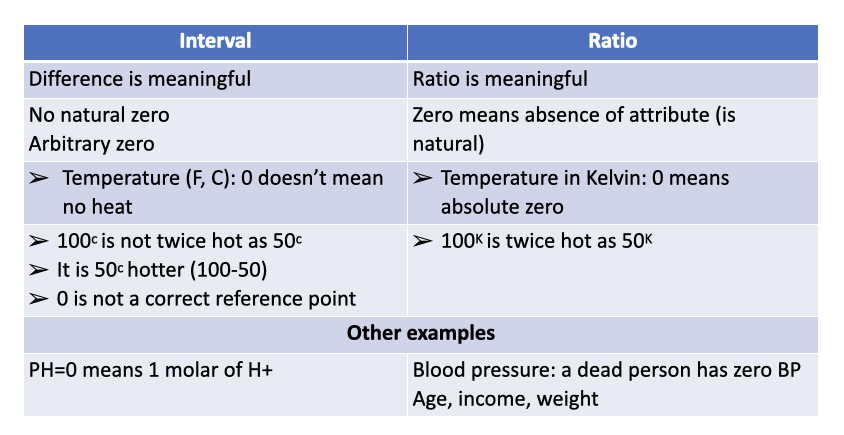
Interval Variables
Difference is meaningful
no natural zero
arbitrary zero
no natural zero
arbitrary zero
16
New cards
Ratio variables
Ratio is meaningful
zero means absence of attribute (is natural)
zero means absence of attribute (is natural)
17
New cards
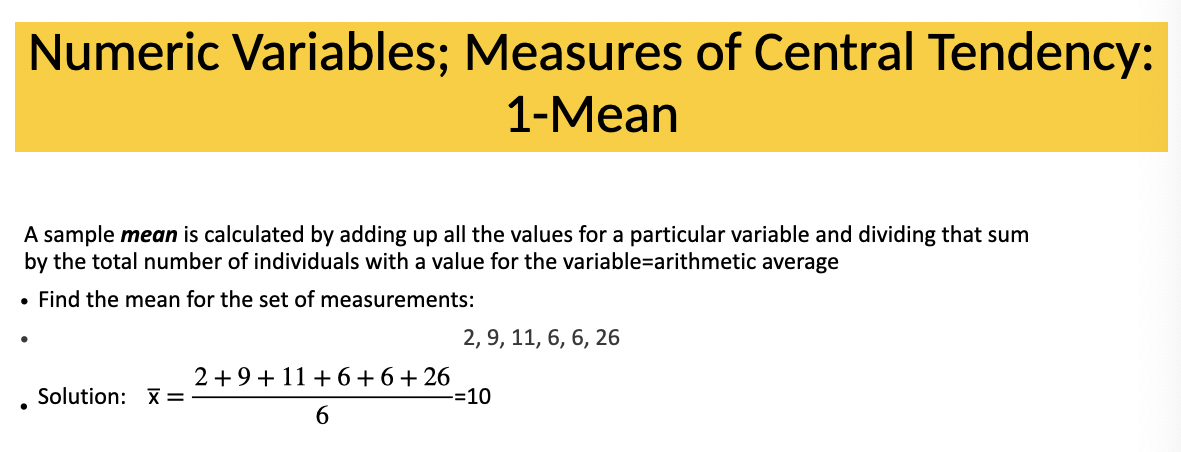
Mean
calculated by adding up all the values for a particular variable and dividing that sum by the total number of individuals with a value for the variable = arithmetic average
18
New cards
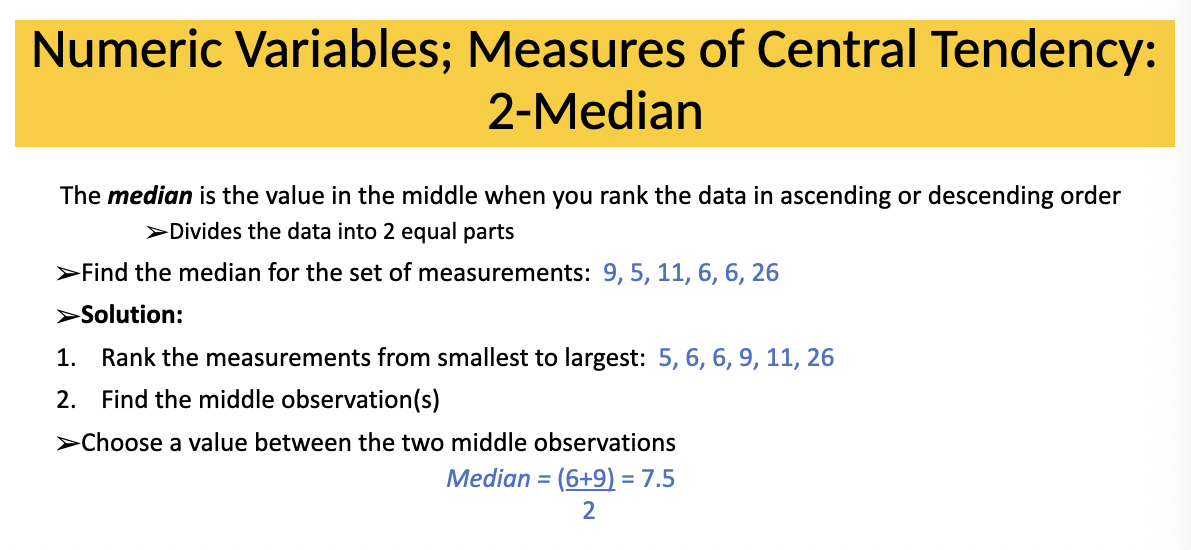
Median
The median is the value in the middle when you rank the data in ascending or descending order
- divides the data into 2 equal parts
- divides the data into 2 equal parts
19
New cards
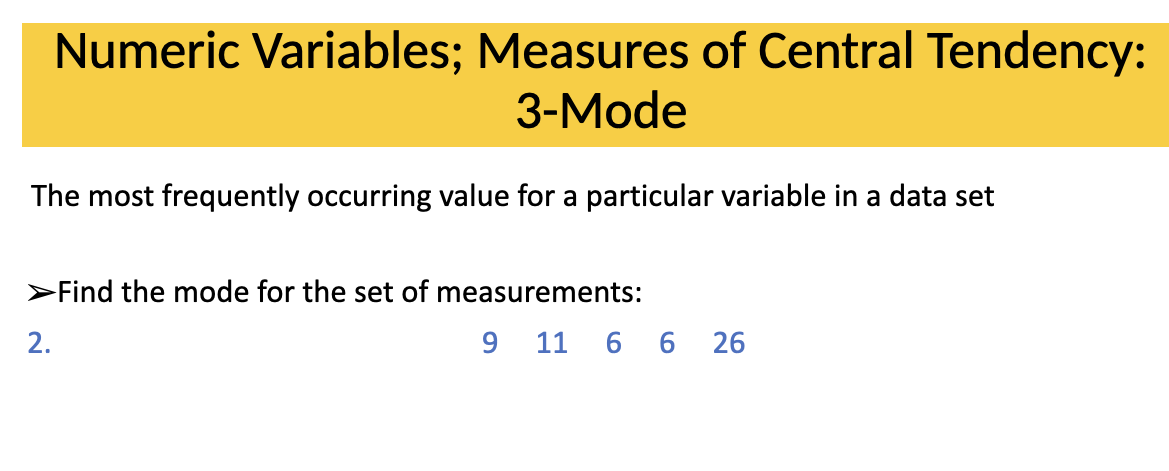
Mode
The most frequently occurring value for a particular variable in a data set
20
New cards
Histogram
*not to be confused with Bar Chart
- important to manage the intervals
- important to manage the intervals
21
New cards
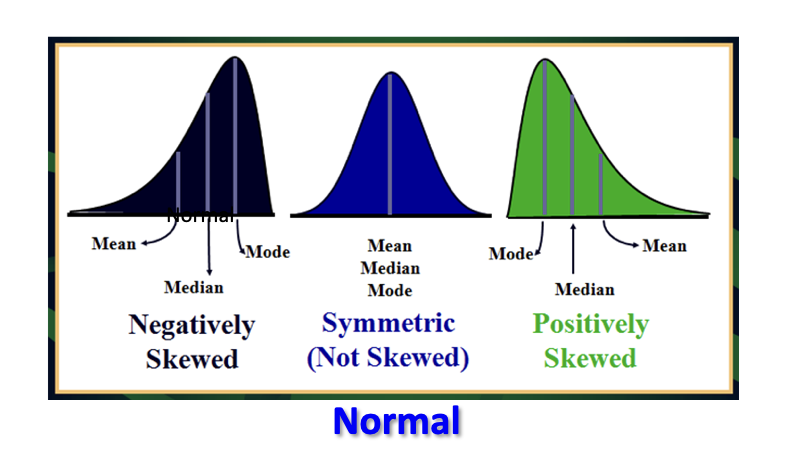
Histogram normal distribution
22
New cards
Range
The range for a variable is the difference between the minimum (lowest) and the maximum (highest) values in the data set
23
New cards
Quartiles
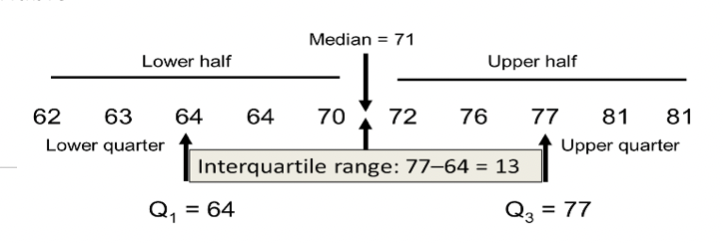
mark the 3 values that divide a data set into 4 equal parts
- the interquartile range (IQR) captures the middle 50% of values for a numeric variable
- the interquartile range (IQR) captures the middle 50% of values for a numeric variable
24
New cards
Boxplot
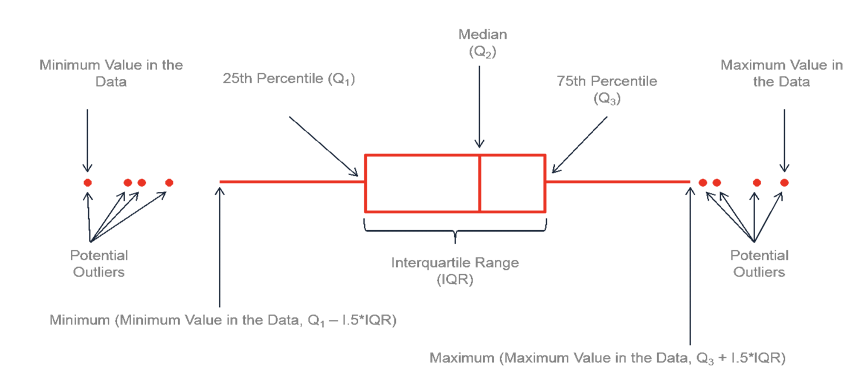
A simple visual depiction of an intuitive way to explore the data
25
New cards
variance: σ2
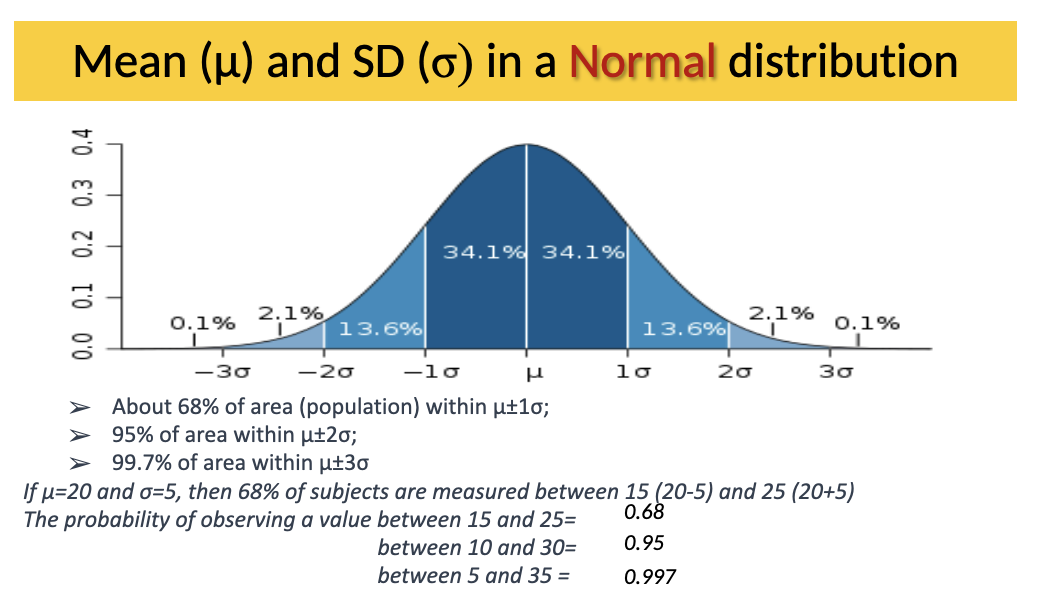
The extent of deviation from the average value of that variable in the data set
- Calculated by adding together the squares of the differences between each observation and the sample mean (µ) and then dividing by the total number of observations
- Calculated by adding together the squares of the differences between each observation and the sample mean (µ) and then dividing by the total number of observations
26
New cards
Standard deviation: σ
the square root of the variance
27
New cards
Standard error
Standard error of the mean adjusts for the number of observations in the data set by dividing the variance by the total number of observations and then taking the square root of the number
28
New cards
Mean and standard deviation
29
New cards
Confidence intervals (CI)
Provide information about the expected value of a measure in a source population based on the value of that measure in a study population
- A larger sample size will yield a narrower confidence interval
- A larger sample size will yield a narrower confidence interval
30
New cards
A confidence interval is usually: __%
95%
meaning, 5% of the time, the confidence interval is expected to miss capturing the true value of a measure in the source population
eg,
We are 95% confident that the real average is between 110-130; 5% chance that the true value of mean is either larger than 130 or smaller than 110
meaning, 5% of the time, the confidence interval is expected to miss capturing the true value of a measure in the source population
eg,
We are 95% confident that the real average is between 110-130; 5% chance that the true value of mean is either larger than 130 or smaller than 110
31
New cards
Comparative statistics
Comparing main factors between exposed and unexposed in cohort studies
Average age of exposed=Average age of unexposed
% male in exposed=% male in unexposed
Testing if randomization was effective in experimental studies
Comparing the outcome status
We can NOT just look at the calculated values (these are estimates from samples, subject to random sampling error)
Average age of exposed=Average age of unexposed
% male in exposed=% male in unexposed
Testing if randomization was effective in experimental studies
Comparing the outcome status
We can NOT just look at the calculated values (these are estimates from samples, subject to random sampling error)
32
New cards
Inferential statistics
Techniques that use statistics from a random sample of a population to make evidence-based assumptions (inference) about the values of parameters in the population as a whole
Decision about parameters via information obtained from a sample is via hypothesis testing
Decision about parameters via information obtained from a sample is via hypothesis testing
33
New cards
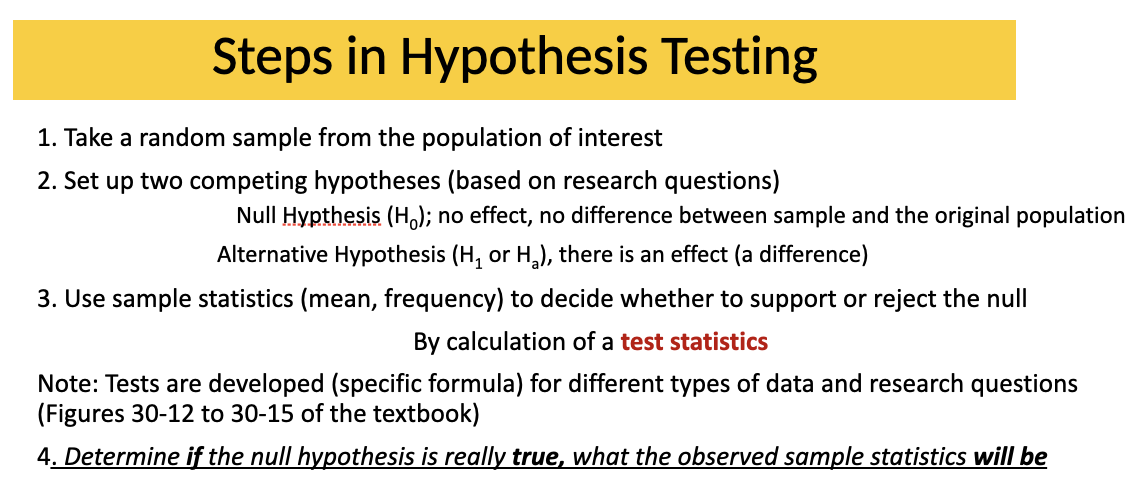
Hypothesis testing
Aim:
- To test an explicit statement or a ‘hypothesis’ about a population parameter
- To test an explicit statement or a ‘hypothesis’ about a population parameter
34
New cards
The null hypothesis (H0)
there is no difference between the two or more values being compared
35
New cards
The alternative hypothesis (Ha)
there is a difference between the two or more populations being compared
36
New cards
Idea of probability - p. value
observed sample supports the null
Between 0.1 and 0.9: no reason to suspect null is false
<0.02 sufficiently strong evidence to conclude null does not reflect the state of nature, unlikely to be true
“The value for which P=0.05, or 1 in 20; it is convenient to take this point as a limit in judging whether a deviation is to be considered significant or not."
0.05 the convention commonly used in health research
*P.value measures how strongly the sample data agrees with the null
Between 0.1 and 0.9: no reason to suspect null is false
<0.02 sufficiently strong evidence to conclude null does not reflect the state of nature, unlikely to be true
“The value for which P=0.05, or 1 in 20; it is convenient to take this point as a limit in judging whether a deviation is to be considered significant or not."
0.05 the convention commonly used in health research
*P.value measures how strongly the sample data agrees with the null
37
New cards
Significance level: α
the p value at which the null hypothesis is rejected, usually 0.05 in health research
38
New cards
Parametic test
assumes the variables being examined have particular distributions
- inferential methods are based on types of distributions (mostly normal)
- inferential methods are based on types of distributions (mostly normal)
39
New cards
Nonparametic test
does not make assumptions about the distributions of responses
- Nonparametric tests are used for ranked variables and when the distribution of a ratio or interval variable is non-normal
- Nonparametric tests are used for ranked variables and when the distribution of a ratio or interval variable is non-normal