Measurement
 Call Kai
 Learn
 Practice Test
 Spaced Repetition
 Match
 Flashcards
 Knowt Play
1/31

There's no tags or description
Looks like no tags are added yet.
32 Terms
Absolute Error
a measurement of the difference between a measured value and its true value
Error (in measurement)
Error is a numerical value that tells us how far "off" a measurement is compared to the correct or accepted value.
Tolerance (in stats)
the amount of measurement error that is allowed
The Metric System
a standard system of measurement based on powers of 10.
Example.
meters, liters, grams

English system / Imperial system
a system of measurement used in the United States using units such as feet, pounds and ounces
Dimensional Analysis / Unit Analysis
the process of converting within or between systems by multiplying by factors of 1 in various forms

Relative Error / Percent Error
a proportion of how large the absolute error is to the true value
Invariance
Consistency of the size or magnitude of a value regardless of a change in units.
Example.
Converting a length from cm to inches does not change the length.
Hand Lens
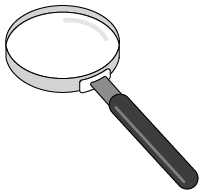
A small, portable device consisting of one or more lenses that magnify objects
Example.
Magnifying Glass
Triplet Hand Lens
Controlled Variable
a variable that is kept stable throughout the experiment, across control and experimental groups, to ensure that any difference in the dependent variable is because of the independent variable.
Example.
In an experiment investigating the effect of amount of light on plant growth, the amount of water would be a controlled variable since it is not being studied.
Experimental Investigation
Researchers assign subjects in the sample to certain treatments, then observe the effects of the treatment. Can show causation (cause and effect).
Example.
Does using algebra tiles during instruction help freshman students learn how to solve equations?
Quasi-Experimental Research
type of non-experimental investigation in which the researcher studies the effects of an independent variable, but chooses experimental groups rather than assigning them randomly
Example.
a nutritionist starts a nutrition education program at one nursing home and not at another one, then compares the health of the residents at each nursing home afterward
Accuracy
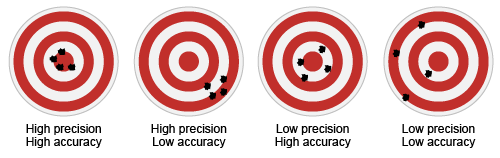
a set of different values which are close to a true value. When measuring with a tool, the tool is accurate to 1/2 of the smallest measuring unit
Example.
a group of darts near the target
Positive Correlation
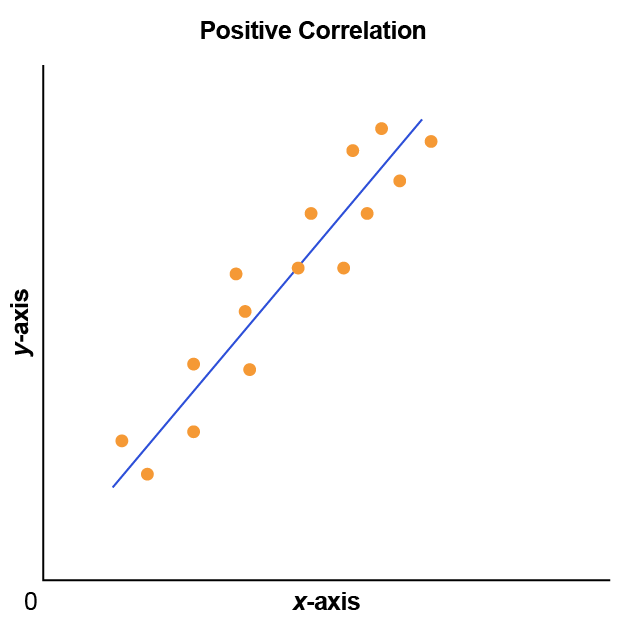
a positive relationship between data points on a graph; as one variable increases, so does the other; produces a trend line with a positive slope
Beam Balance
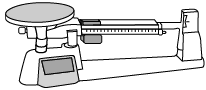
A device made up of a lever with two or more beams, sliding masses, and one or more pans on which to place objects used to measure mass
Example.
Double Beam Balance
Triple Beam Balance
Disequilibrium
occurs when a child cannot use existing schemas to comprehend new information
Example.
A child moves to a new country. The new classroom rules are difficult to assimilate on top of the previous classroom rules.
Scientific Theory
a proposed explanation for a phenomenon which may not be testable
Example.
Darwin's Theory of evolution
Non-Experimental Investigation
a research method in which conditions are not carefully controlled; the scientist may study an independent and/or dependent variable, but does not control the other factors in the investigation
Example.
survey, observation, analysis of observed behavior
Measuring Tape
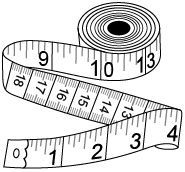
A long, thin, flexible tool divided into centimeters (cm) and millimeters (mm) and used for measuring length
Scientific Law
a proven explanation for a phenomenon
Example.
Newton's Laws of Motion
Precision
a set of different values which are close to one another
Example.
a group of darts near one another
Histogram
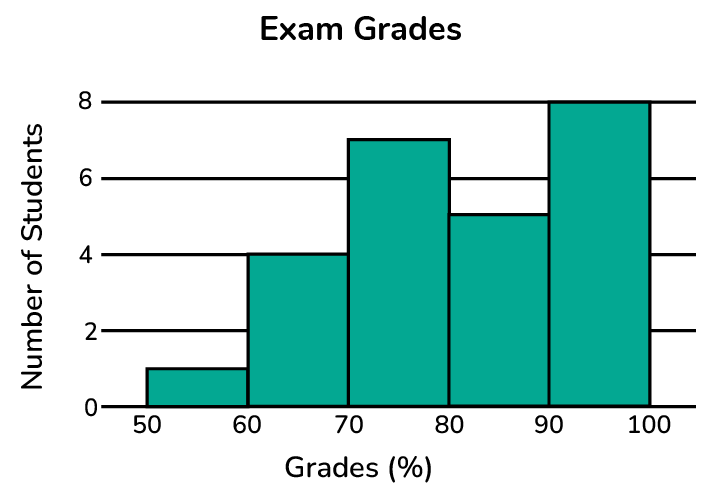
a visual representation of data which compares frequencies of different numeral intervals
Margin of Error
deviation or variation of a value from the correct or expected value to allow for error in equipment or calculations
Single-Variable Research
type of non-experimental investigation in which the researcher makes observations before and after the application of a treatment or question
Example.
hidden-camera shows in which a magician tries the same trick with different groups of people
Scientific Method
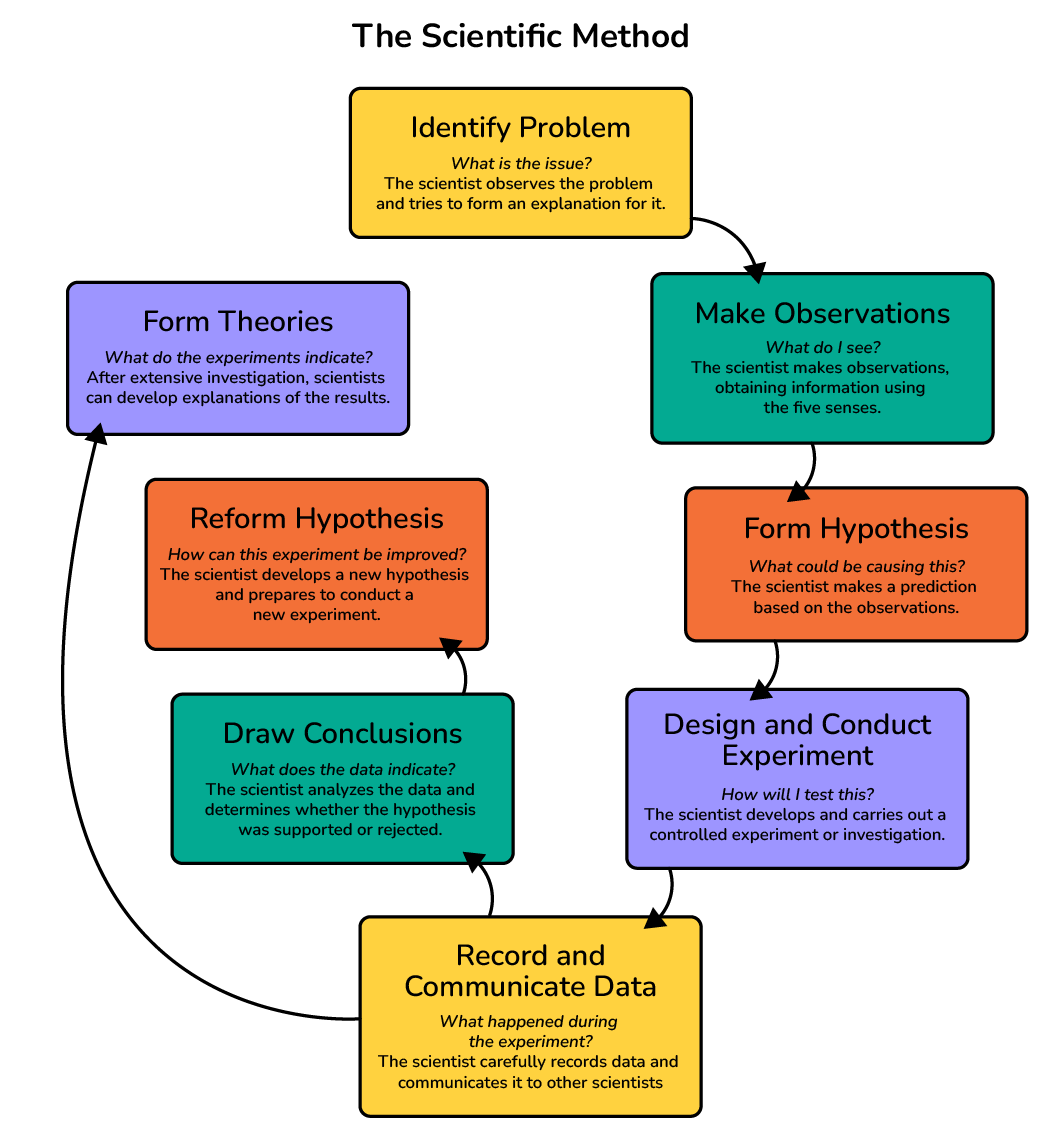
a series of deliberate steps by which scientists observe, hypothesize, test, analyze data, and communicate results
Negative Correlation
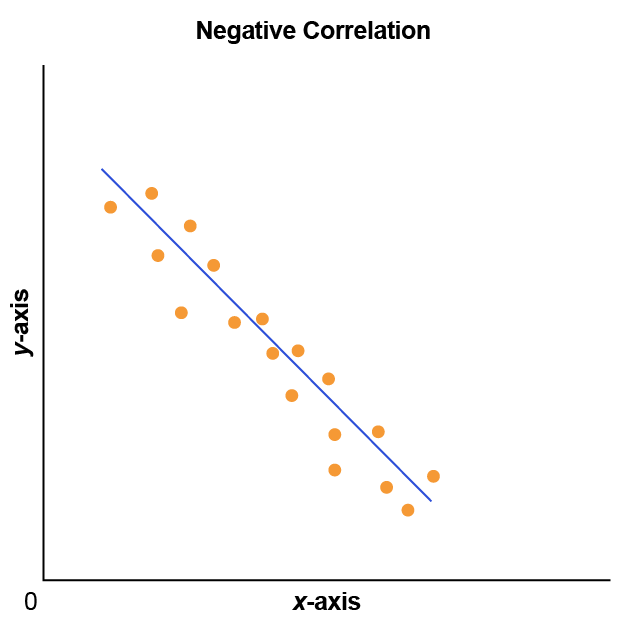
a negative relationship between data points on a graph; as one variable decreases, the other variable increases; produces a trend line with a negative slope
Observation
information gathered using the five senses
Example.
smell, color
Significant Figures
digits of a number used to indicate the accuracy of the measurement
Example.
101 has three significant figures and is accurate to the ones place
Correlational Research
type of non-experimental investigation in which the researcher may study two variables, but does not control the rest of the conditions of the study
Example.
a teacher who gives students one questionnaire about how many in-class activities they participate in and one about how engaged they feel in class
Assimilation
a process in which existing schemas are applied to new objects or situations
Stem-and-Leaf Plot / Stemplot
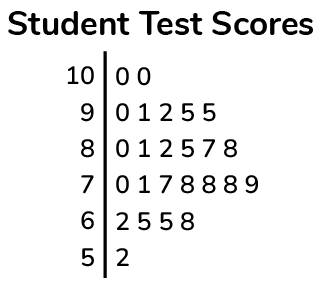
a plot that splits each data value into a "leaf" (usually the last digit) and a "stem" (the other digits). Stemplots are used for smaller sets of quantitative data. You can easily identify outliers, data clusters, or gaps on a stemplot.