exam test #2 money - inflation
 Call Kai
 Learn
 Practice Test
 Spaced Repetition
 Match
 Flashcards
 Knowt Play
1/44

There's no tags or description
Looks like no tags are added yet.
45 Terms
money is defined as
medium of exchange
store of value
unit of account
Today currency is mostly composed as
banknotes
Money is a special type of …
IUO (I owe you) that everyone trusts
fiat money
money that is not convertible to any other asset (such as gold or other commodities).
• can only be repaid in more fiat money.
• The value of fiat money lies in the fact that it is universally accepted as a medium of exchange
Sovereign currency
When fiat money is issued by a sovereign country
Why do people accept fiat money even though it is not intrinsically worth anything?
Because the government only accepts fiat money in payment of
taxes. This necessitates the holding of fiat money by citizens
How is money created
Creation of public bank money (sovereign money)
2. Creation of private bank money (bank money)
2 types of money
private
public
The government creates money through…
the execution of monetary policy
Most of the money in the economy is produced by private banks through…
bank lending
Aggregate demand
defined as the sum total of the demand for all different goods and services purchased in the economy
Aggregate supply
defined as the sum total of the supply of all the different goods and services produced in the economy

Market equilibrium
The aggregate demand & aggregate supply curves can be
combined to obtain the market equilibrium price level (P*) &
output (Y*) for the whole macroeconomy.
General equilibrium
the state of all markets in the economy being in equilibrium.
Equilibrium price
price at which quantity supplied equals quantity demanded.
Equilibrium quantity
amount of a good or service bought and sold at the equilibrium price
Exogenous factors
consumers income
consumers preferences
consumers info
number of consumers in the market
consumers expectation in the market
answer is always exogenous
changes lead to shifts in the aggregate demand curve
Endogenous factors
price
changes lead to movements along the aggregate demand curve
normal wage
actual amount of money a worker earns,
real wage
What your money can actually buy.
formula : nominal wage / price level x 100
M-C-M cycle
money - commodity - more money
Start with money, buy or produce something, sell it, and end with MORE money.
Effective demand
The intersection of D-Z curve
it is the amount of demand that is backed
up by the ability to pay.
Keynesian labor supply curve
Sticky nominal wages: Workers resist wage cuts, so wages do not easily decrease when the economy enters a recession.
Unemployment: When demand for goods and services falls, businesses hire fewer workers. Wages may not adjust downward enough to restore full employment, causing unemployment to persist.
Involuntary unemployment
caused by excessive real wages
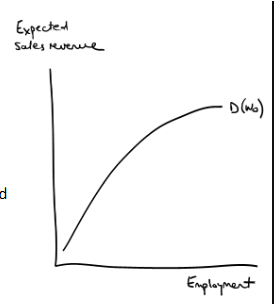
D curve
represents “the proceeds to firms expected from the employment of N men.
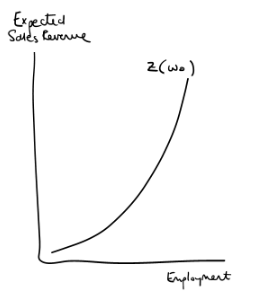
Z curve
the expectation of proceeds which will just
make it worth the while of the entrepreneurs to
give that employment to the Nth worker.”
• It slopes upwards because firms require higher
expected revenue to induce them to hire more
workers.
• slope increases as employment
increases – when aggregate employment is high
and labour markets are tight, firms require higher
expected proceeds to employ more labour – thus
the slope of the Z curve increases as we move
away from the origin due to the perceived
tightness and expected rising costs of increasing Y
Components of D:D1 & D2
D1: the component of demand (D) that rises with employment and income.
It is most associated with consumption.
D1 slopes upwards.
D2 is the component of demand (D) that does not rise with employment and income – investment spending, government expenditure and net exports.
Hence D2 is horizontal with respect to employment
Demand gap
The fact that not all the income that is paid to workers is spent on
consumption gives rise to the
Fallacy of composition
individual decisions can have different effects when everyone makes the same decision

Classical case
When money wages increase, businesses have higher labor costs. These costs increase more than consumer spending increases, so businesses hire fewer workers and employment decreases.
When money wages decrease, workers have less income to spend, reducing consumer demand. Businesses sell less and employment also decreases.
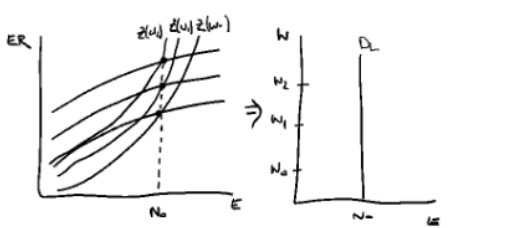
Keynesian case
when money wages change, business costs (Z) and consumer spending (D) change by the same amount.
Because these changes balance each other out, total employment stays the same, even when wages increase or decrease
The Keynesian labor demand curve is vertical because employment stays constant across a range of wages.

Underconsumptionist case
consumer spending (D) increases more than business costs (Z) when wages increase.
Workers earn more money, so they spend more. This increases demand for products, encouraging businesses to produce more and hire more workers.
we have an upward-sloping labour demand curve, reflecting the fact that if money wages increases, employment will increase
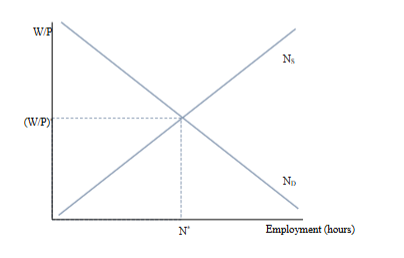
Labor market equilibrium
the right wage and employment level where the number of workers available matches the number of workers businesses want to hire.
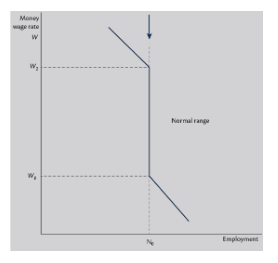
generalized labour demand curve
The curve shows the relationship between money wages and employment. It combines the Classical and Keynesian views.
High wages → employment decreases (inflation - less spending)
middle wages - employment stays the same
low wages - employment decreases (deflation - more spending)
pigouvian effect
Lower prices → Higher real wealth → More spending → Increased aggregate demand.
Effects of inflation
can disrupt the market economy.
• can lead to wealth transfers between debtors and creditors of money.
• cause wages to spiral upwards, squeezing the profits margins of firms unless they increase their prices
effects of deflation
Reduction in Business Revenues
Lowered Wages and Layoffs
causes of inflation/deflation
Cost-push theory
• Demand-pull theory
• Quantity Theory of Money
cost push theory
When it costs businesses more to produce goods, they raise prices, causing inflation.
main cause : labor costs (wages)
wage-price spiral
Workers demand higher wages, businesses raise prices, and the cycle repeats.
Price wage spiral
Businesses raise prices first, then workers demand higher wages.
wage-wage-price spiral
Workers in other industries demand wage increases to match other workers.
demand-pull theory
too many people want to buy goods, but businesses cannot produce enough to meet demand, so prices go up
There is an inverse relationship.
When demand increases, businesses produce more and hire more workers, so unemployment falls while inflation rises.
Quantity theory of money
If the government increases the money supply too quickly, prices will rise and cause inflation.
formula : MsV = PY
V = Constant
Y = Constant
Money supply increases → Price level increases → Inflation increases.

Philips curve
shows the relationship between inflation and unemployment.
Low unemployment - higher inflation
high unemployment - lower infation
stagflation - high inflation & high unemployment