Stats Intro and SPSS
 Call Kai
 Learn
Learn Practice Test
 Spaced Repetition
 Match
Match Flashcards
 Knowt Play
1/43

There's no tags or description
Looks like no tags are added yet.
Name | Mastery | Learn | Test | Matching | Spaced | Call with Kai | Chat |
|---|
No analytics yet
Send a link to your students to track their progress
44 Terms
relevant statistical tests
associations
Pearson’s correlation
chi-square test of association (2 × 2)
relative risk (2 × 2)
odds ratio (2 × 2)
diagnostic accuracy
sensitivity and specificity
positive and negative predictive value
positive and negative liklihood ratios
reliability
Cohen’s kappa
difference between groups
independent-samples t-test
paired-samples t-test
one-way repeated measures ANOVA
mixed ANOVA
odds
how likely an event is to happen
risk
probability of having a specific event
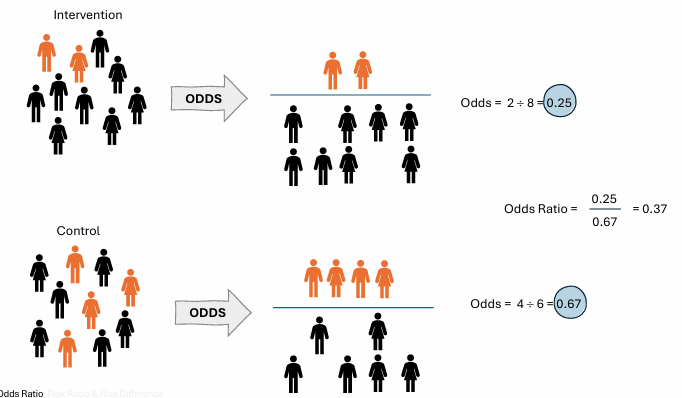
intervention vs control odds
the odds of experiencing the outcome in the intervention group is 0.37 times the odds in the control group
for every 37 persons who experience the event in the intervention, 100 persons will experience the event in the control group
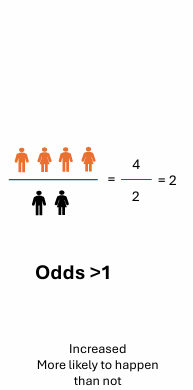
odds > 1
increased
more likely to happen than not
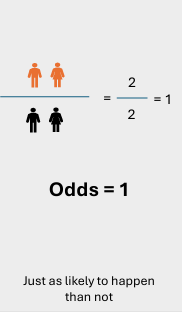
odds = 1
just as likely to happen than not
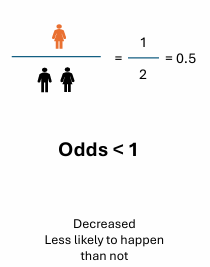
odds < 1
decreased
less likely to happen than not
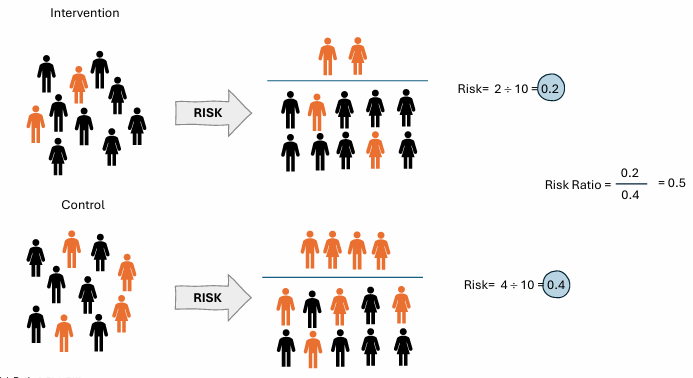
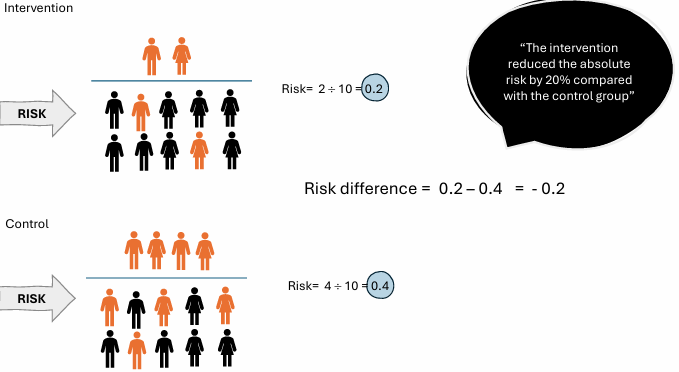
intervention vs control risk
the risk of the outcome in the intervention group is 0.5 times the risk of the outcome in the control group
the risk of the outcome is reduced by 50% among participants in the intervention group compared to control group
risk difference
sensitivity
measures a tests ability to correctly find people who have a condition (true positive)
high sensitivity catches “sick people” and avoids missing cases
specificity
measures a tests ability to correctly find people who do not have the condition (true negative rate)
high specificity avoids false alarms
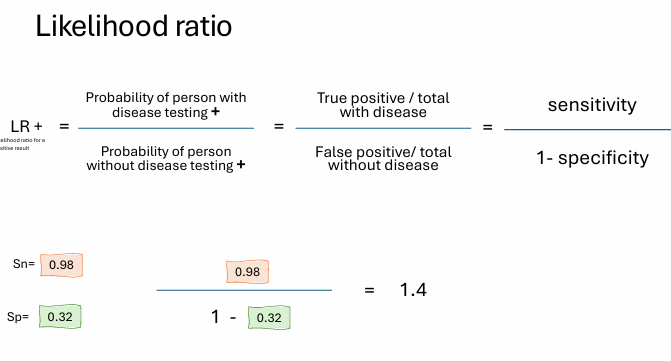
likelihood ratio (LR)
probability of finding patients with a disease / probability of same findings in patients without the disease
LR +
indicates that a positive test result is more likely to occur in a person WITH the condition than in a person without the condition
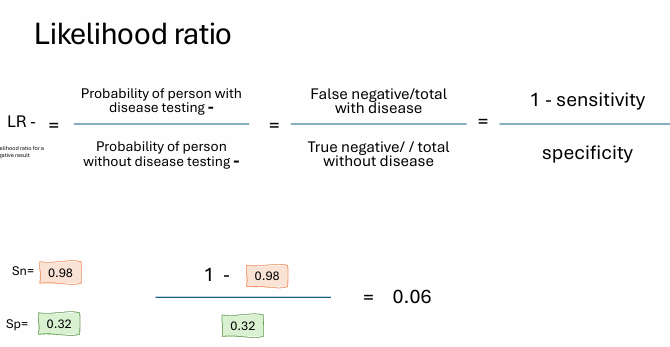
LR -
the test is less likely to be negative in someone with the condition than in someone without it
lower value indicates better performance of the test in ruling out the condition
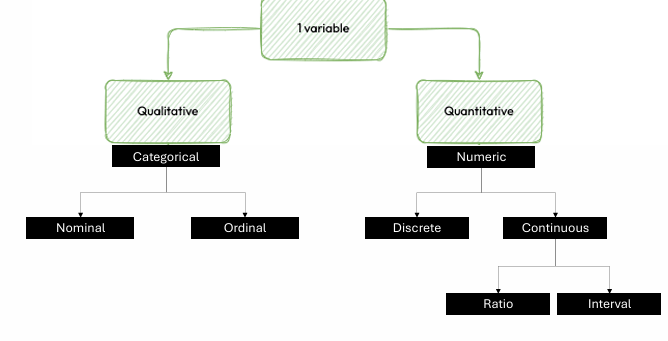
1 variable can be
sensitivity calculation
true positive (TP) / true positive (TP) + false negative (FN)
high sensitivity
high true positive (TP)
low false negative (FN)
sensitivity calculation example
true positive (TP) = 79
false negative (FN) = 21
false positive (FP) = 9
true negative (TN) = 891
79 / 79 + 21
= 0.79
SNOUT
Highly sensitive test is positive in almost everyone with the disease, but it would hardly ever be negative in a person with the disease…
sensitive … negative … OUT
high specificity
high true negatives
low false positives
low specificity
low true negatives
high false positives
specificity calculation
true negative (TN) / true negative (TN) + false positive (FP)
specificity calculation example
TP = 79
FN = 21
FP = 280
TN = 620
620 / 620 + 280
=0.69
SPIN
specific
positive
in
LR+
LR-
paired samples t-test
differences within group
same group being measured pre and post intervention
paired samples t-test example question
H0 = There is no difference between quadriceps strength prior to and post an exercise intervention
independent samples t-test
differences between groups
ie. quad tendon graft vs hamstring tendon graft
2 separate groups independent from each other
ANOVA
differences between multiple groups
ie. quad graft, hamstring graft, cross-bracing protocol
f-value
one-way repeated measures ANOVA
differences within groups
ie. quad tendon graft group strength measured 2x immediately post surgery and 4-weeks post
one-way repeated measures ANOVA example hypothesis
H0 = There is no difference between quadriceps strength prior to, immediately post, and 4-weeks post an exercise intervention
two-way mixed design ANOVA
differences between and within groups
ie. quad graft, hamstring graft, cross-bracing strength post exercise program
t-test
determines if there is a difference between groups
closer the number is to 1, the less likely there is a differences
larger it is, more likely there is a true difference
seen by significance value (sig. 2 tailed)
ie. .505 (above 0.05) - insufficient evidence to reject the null, while there is a difference in mean scores it is due to chance

interpret this table
t = -.698
strong negative relationship (number closer to 1)
sig. (2-tailed) = .505
(above 0.05) cannot reject null hypothesis - difference in mean scores is due to chance
CI 95% and mean difference -3.2
we are 95% certain where the true mean difference lies
on average lectures drink 3.2 drinks less than students
however we are 95% sure, this average is between 13 less drinks and 7 more drinks than students
so we cannot be certain lectures drink more than students
when to use ANOVA
Interested in results between groups and the groups are independent from another
more than 2 samples
homogenity of variance test
equal variance in each of the groups
post-hoc - tukey
tells us where the differences are between the groups

significance value should not be below 0.05
therefore we can conclude the assumption of equal variance has not been violated

interpert this table
significance value .002
below significance level of 0.05
yes there is a significant difference between the groups (but where? - multiple comparisons table)

multiple comparisons table
determines where differences lie
row 1- lecturers have 9.4 differences in neurotisism than parents
p = 0.002
statistically significant

0.0 occurs 180 times
% agreement of 88.2% between reviewer 1 and 2
does not account for chance
kappa analysis
evaluates inter-rater reliability or the degree of agreement for categorical (nominal or ordinal) data while correcting for random chance

kappa value = 0.627
kappa takes into consideration chance
62.7% agreement
above .6 = good agreement