BIOL 251 Midterm 3
 Call Kai
 Learn
 Practice Test
 Spaced Repetition
 Match
 Flashcards
 Knowt Play
1/43

There's no tags or description
Looks like no tags are added yet.
44 Terms
Community & Interactions
Ecological Community is an assemblage of pop of various species living close enough for potential interaction
Community interactions are classified by whether they help, harm, or have no effect on the species involved
Interspecific interactions can affect the survival and reproduction of each species
Effects can be positive (+), negative (-), or no effect (0) on fitness.
Community Interactions Table
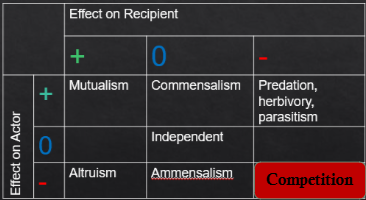
Competition
Competition: the interaction b/w 2 orgs using the same limited resources.
Both individuals are negatively affected — directly or indirectly
Experience reduced fitness
Can be a driving forces of adaptation & evolution
Plants are most often competing for water, light, nutrients, or physical space.
Animals are most often competing food, territory, and for mates.
Direct vs Indirect Competition
Direct Competition
interference competition: competing individuals (usually of the same species) directly interact in an attempt to reduce the other's access to resources
e.g. allelopathy: chemical warfare among plants
e.g. territoriality among animals (requires mobility)
Indirect Competition → mediated through a 3rd party
resource competition: consumption of a resource by one individual ends up depriving another individual of that resource
e.g. preemption: individuals prevent others from using a location by arriving first
Fundamental vs Realized Niche
Competition occurs because of niche overlap among individuals
Niche: the set of conditions and resources needed by a species for survival and reproduction
Hutchinson’s Niches:
Fundamental Niche: complete set of env conditions in which the species can potential survive and reproduce
Realized Niche: set of env conditions in which the species is actually found in nature, a subset of the specie’s fundamental niche
Elton’s niche description is defined by its so-called trophic position (essentially where it sits in the food web) and the functional attributes of the species that allowed it to specialize on those foods.
Competitive Exclusion Principle + Example
Competition Exclusion Principle: no 2 species can occupy the exact same niche. If they do, the better competitor (grow or reproduce more quickly) will always win.
Gause’s Law: a tale of 2 Paramecium species
P. aurelia and P. caudatum follow the same trends when grown separately as they have the same K. But when grown together, the larger P. caudatum had an advantage at first, but the smaller and faster P. aurelia quickly overtook it.
P. aurelia pop kept growing while P. caudatum’s pop shrank. P. aurelia reached its K and P. caudatum vanished. They competed for limited resources.
Interspecific vs Intraspecific
Competition can be intraspecific or interspecific
Interspecific is b/w individuals of diff species that require the same limiting resource due to some niche overlap
Intraspecific is b/w individuals of the same species — if competition b/w individuals of the same species for a limiting resource is strong, then individual performance is subject to negative density dependent growth, survival and/or reproduction
the mechanism through which resource limitation constrains pop growth & b/c individuals of the same species have greater niche overlap, intraspecific interaction is strong
Population Growth
w/ unlimited resources, a pop will grow at its intrinsic rate of growth r.
modeled w/ the exponential growth equation: dN / dt = rN.
When resources are finite, density dependent factors constrain the growth rate as N approaches K, so pop growth drops below r, reaching ~0 at K.
For logistic growth: increase in competition = decrease in resource abundance and K
Interspecific Competition
Occurs when individuals of one species limit the resources available to another species
Typically, negative outcome for both species, but depends on their relative competitive ability
When growing in competition w/ other species, K is affected for at least the weaker competitor species.
Eq pop size: species i ceases to change pop size (Ni).
Competing pop are at eq pop size when dN1 / dt = dN2 / dt = 0
occurs when Ni < Ki in interspecific competition
Competitive Exclusion
The competitive exclusion states that 2 species w/ the same niche cannot coexist.
Strong competition leads to competitive exclusion of the weaker competitive species. Competitive exclusion is a result of asymmetric competition.
Asymmetric competition – one species suffers a much greater fitness decline than the other species (but both -/-)
Symmetric competition – each of the interacting species experiences a roughly equal decrease in fitness
Weaker competitor squeezed out of portion of its fundamental niche to its realized niche
Competition Coefficients
Competition coefficients: the per capita effect on the growth of one species (1) of a second species (2) = α1,2
First coefficient = species is being affect by second coefficient = doing the effecting
Used to quantify the relative competitive strength of individuals of a diff species vs. a member of the same species.
The closer α1,2 = 1, the more species 2 has a competitive effect on species 1 like species 1 has on itself
Basically, α1,2 is a conversion factor for species 2 making it equivalent in competitive effect to individuals from species 1.
Lotka-Volterra Competition Equations
Used to estimate equilibrium pop sizes of 2 competing species.
If α1,2 < 1, effect of interspecific competition is less than the effect of intraspecific competition on species 1
If α1,2 > 1, effect of interspecific competition is greater than the effect of intraspecific competition on species 1
Phase Planes I
It helps visualize which species would win a competitive interaction by plotting N of both species against each other.
If steady state does NOT depend on initial Ns, then it is “globally stable”.
Can be rep by a phase portrait
Where dN1/dt = 0, N1 is unchanging
r1 = 0, N1 = 0, and N1 = -α1,2N2 + K1
Isocline of 0 pop growth for species 1.
Phase Planes II
When the zero growth isoclines do not intersect, stable coexistence is not possible - the species w/ the isocline furthest from the og will exclude the other
When the zero growth isoclines intersect, a stable coexistence is possible → tend toward their eq pop sizes.
Could also have competitive exclusion, w/ outcome dependent on initial pop size
Phase Planes II Pic

Competition in the Real World
Lots of evidence that competition has a big negative effect on species across a range of trophic levels in the real world too
Some trophic levels are more affected by comp than others
Exp that caged-in pop yielded stronger effect of comp - spatial partitioning
One mechanism that can explain coexistence despite comp has to do w/ spatial and temporal variations prevent competitive exclusion
Coexistence
What enables ecologically similar species to coexist?
Env heterogeneity in time
Spatial uneven distribution of resources
Predators’ mediate competition
Exploitation Interactions
Exploitation interactions benefit the actor (species A) to the determinant of the recipient (species B)
Parasitism — animal lives in or on its prey, may or may not kill it
Not technically predators
Herbivory — animal eats a plant
Predation — animal consumes another animal, killing it
Parasitism
Depend on 1+ host to complete their life cycle
high degree of specialization to host or even host organ
High specialization allows high diversity
Selection pressure balances virulence and host survival (but see parasitoids)
Parasites — rarely lethal
Parasitoids — eat host from the inside out, host is usually fully consumed and goes from larvae to adult size and emerges from host to reinfect (i.e. wasps)
Transmission b/w hosts can be passive, active or host-to-host
Complex life cycles w/ diff mobility/behaviors/resource needs
Can have broad ecological impacts
Ectoparasites vs Endoparasites
Endoparasites → found inside hosts & have to worry about the host’s immune system (a trade off as they are protected from the outside environment)
Cleaner wrasse specialize on eating ectoparasites → coral reefs w/ cleaner wrasse have fewer fish w/ ectoparasites than reed w/o cleaner wrasse
Ectoparasites avoid the host’s immune system
More exposed to predation & the harsh outside world
Herbivory
Most herbivores don’t kill the whole plants, so not truly “predation of plants”
Grazers — specialize on herbaceous plants
Browers — specialize on woody plant (leaves, bark, twigs)
Granivores — specialize on seeds
Frugivores — specialize on fruits
Grazers & Browers’ plants are high in cellulose. Require mutualism w/ symbiotic microbes to digest the cellulose.
Hindgut fermenter eats the food only once while ruminants eat it and then rechew it again. So, food chewed twice.
Defense Against Herbivory
Plants can evolve defenses against herbivory
Mechanical → Developing structures like thorns that make it harder for animals to eat them.
Chemical → Producing chemicals that are noxious or poisonous to herbivores.
Nutritional → Growing structures that are less nutritious for grazers (have less N and P) so predators eat others that are more nutritious
Tolerance → Adaptions to regrow quickly after being grazed.
Defense expression can also be an acclimation
Predator/ Herbivory Mediated Coexistence
Beetle herbivory suppresses the growth by the dominant plant species (golden rod)
W/o the beetles (by adding pesticides), golden rod outcompete the other plants and plant diversity drops
Counter-intuitive, but herbivory sometimes maintains plant biodiversity
Predation
4 modes of predation
Stalk → hiding behind trees and brush until they can get close enough to pounce on a hare (leopard vs ostrich b/c leopards cannot run for long distances)
Pursuit → where the predator chases prey over a distance (wolf vs hare)
Ambush → where the predator hides and waits in one spot until prey comes along
Random Encounter → where the predator and prey meet by chance (i.e. spiders and flies)
Species can be flexible in the type of strategy they use to kill their prey
Defense Against Predation
Chemical → Producing chemicals that are noxious or poisonous to predators
Physical → Developing physical barriers to predators (i.e. shells)
Aposematism → Warning colors, sounds, or other characteristics to alert predators that this prey will not be tasty
Crypsis → Camouflaged colors, shapes, and other ways of hiding from predators (i.e. bugs that look like sticks)
Mimicry → Looking, sounding, or in other ways mimicking a species that predators avoid
Behavioral → Behaving in ways that minimize risk from predation
The Predator Encounter Term
Modify the exponential growth eq to include a predator encounter term
Encounters w/ a predator reduces the rate of increase in the prey pop
More predators = more encounters
Fewer prey = fewer encounters
The Prey Consumption Rate
Search efficiency or attack rate can vary by predator, w/ some being more efficient predators than others.
Search efficiency coefficient of the predator is a
a times the predator encounter term gives the Prey Consumption Rate
The Predator Population Growth & Dynamics
Model the predator’s pop dynamics
Prey consumption rate
add in the conservation coefficient (b) for how many preys a predator must consume before it has accumulated enough resources/energy to have offspring
larger predators needs more prey to make another large predator
dNpredator / dt = abNpreyNpredator
we also need to account for predator mortality (m)
dNpredator / dt = abNpreyNpredator - mNpredator
Waveforms
A waveform has 2 key properties
The amplitude: the difference between the peak of the cycle and the trough between cycles
The period: the amount of time from one peak to the next peak in the cycle, or one trough to the next trough.
Phase Planes
Phase planes represent interspecific relationships - how pop sizes of predators and prey change relative to one another.
# of individuals in the predator pop on the Y-axis
# of individuals in the prey pop on the X-axis
The dimensions (height and width) of the “circle” tells us about the amplitude of the two waveforms in the predator-prey population cycle, but the phase plane does not tell us anything about the period
Phase Portraits
The amp of the phase plane b/w predator and prey pop size will depend on the starting pop sizes.
A phase portrait shows whether the predator and prey pop will increase or decrease in the next timestep, given diff starting conditions
Varies b/w max and min
Prey will shrink when predators > -25
Predators will shrink when prey < -50
Zero Growth Isoclines
Lines representing the pop size at which the growth rate is 0.
above the line = pop shrinks
below the line = op increase
Depending on where the initial population sizes plot out around the zero growth isoclines, we can predict what the populations will do in the next time step.
Bottom left - Prey increase, predators decrease
Upper right – Prey decrease, predators increase
Bottom right – prey and predators both increase
Upper left – Prey and Predators both decrease
If the starting pop are at the intersection b/w the 2 zero growth isoclines , neither pop will grow or shrink so the cycle won’t either
Lotka-Volterra Predatory-Prey Model Assumptions
Prey and predator pop are growing exponentially - no density dependence
All predator and prey individuals have an equal prob of encounters - the pop are well mixed and evenly spread out
Closed system - no i or e of predators or prey
no other cause of death for the prey than being consumed by predator
Prey is the only food source for predator - no prey switching or subsides
No prey handling time (h), as predator catches and consumes prey instantaneously
Pop stabilize
Introducing a carrying capacity causes the amp of the pop cycles to dampen until they stabilize
The lower the carrying capacity (K), the higher the density dependence
The lower the carrying capacity, the faster the pop stabilize
As they stabilize, they’re no longer neutral stable
Predator Self-Limitation
Intraspecific competition among predators. The stronger the self-limitation, the more the isocline will bend to the right.
Npredators stabilize at a lower value
Nprey stabilize at a higher value
Refugia
assumptions of well-mixed, evenly distributed prey and predators, so that encounters are equally probable for any individual in the pop
Refugi benefit prey at low Nprey, helping them avoid predation
Predators are not equally efficient
Prey may have refugia from predators, which protects small prey pop
Functional Response of Predator
C.S. Holling (1959) described how a predator’s feeding rate changes w/ prey density
Generally, as prey become more abundant, the predator’s feeding rate increases
Type I: random encounter predators + no handling time
Type II: specialists w/ handling time
Type II: prey-switching generalists or prey w/ refugia
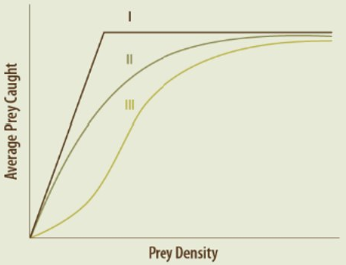
Functional Response of Predators — Type I
Lotka-Volterra model gives pop-level responses of the predator and prey pop
Predation rate is the same for all predators in the pop: aNpreyNpredator
Assuming each predator will eat prey in direct proportion to how many prey are nearby
Assume at one point, predation rate caps out b/c predator becomes full, so it is a straight line before plateauing to a flat line
Type I example
Web spinning spiders will catch all the prey that are trapped in their web
As prey density increases, the # of encounters goes up and so the avg # of prey per predator goes up proportionately
Linear slope = type I functional response
Functional Response of Predators — Type II
Functional Response of Predators — Type III
Ex of type II functional response
red fox consuming deer as fawns
seals consuming salmon
Efficiencies at higher prey density — prey switching generalist predator behavior
learned hunting techniques can be mastered
search image — w/ repeated encounters, predator can improve their ability to detect a prey type
At low densities, prey may avoid predation w/ refugia
C-Evolution Defined
Co-evolution: the product of reciprocal selection, were species living in close associated adapt in response to selective pressure from each other
diffuse (aka guild coevolution)
specific
Co-evolutionary arms race: specific case of co-evolution, where in an exploitative relationship, NS favors
traits that increase the success of the exploiter species
traits that decrease the vulnerability of the exploited species
yields an ongoing struggle b/w competing sets of co-evolution traits that develop escalating adaptations and counter-adaptations against each other, resembling the geopolitical concept of an arms race
Directional Reciprocal Selection
the newt
Red Queen Hypothesis
The faster the mutation rate, the faster a species can evolve
In a battle of reciprocal selection, the faster evolving species will typically outlast the pop of the slower evolving species
Faster rates of mutation associated w/ sexual reproduction are the main explanation for why species reproduce sexually, despite all the costs