8. Population Growth and Life Tables
 Call Kai
 Learn
Learn Practice Test
 Spaced Repetition
 Match
Match Flashcards
 Knowt Play
1/19

There's no tags or description
Looks like no tags are added yet.
Name | Mastery | Learn | Test | Matching | Spaced | Call with Kai | Chat |
|---|
No analytics yet
Send a link to your students to track their progress
20 Terms
Population Growth Models
They are used to predict future population sizes (for management, economics, etc)
Change in population size =
births + immigrants - deaths - emigrants
Exponential Growth Model
Nt = N0 * e^(r * t)
- 'r' is the intrinsic growth rate
- maximum reproduction; minimum deaths
- under ideal conditions
- continuous data
- J-shaped curve
declining population: r < 0
stable population: r = 0
growing population: r > 0

Geometric Growth Model
Nt = N0 * (λ^t)
- λ is the growth rate per year
- λ = N(t+1) / Nt
- no generational overlap
- breeding seasons; time intervals
- discrete data
declining population: λ < 1
stable population: λ = 1
growing population: λ > 1

Whooping Crane
Their population was severely reduced.
-> Their breeding and wintering grounds became protected areas
Rehabilitation program where a scientist pretended to be a mother crane to teach babies behaviors and migration routes via a glider plane

Density Independent Factors
Limiting factors that affect populations regardless of population density
- Usually abiotic factors
- Natural disasters
- Human activity
Density Dependent Factors
Limiting factors that affect populations based on the population density
- Usually biotic factors
Negative DDF: population growth rate decreases as population size increases
- competition
- predation
- disease
Positive DDF: population growth rate increases as population size increases (ALLEE EFFECT)
- more plants result in more seeds that can germinate
- cancer
- meerkats
Logistic Growth Model
(dN/dt) = rN * ( (K-N) / K )
- growth is limited by environment
- at carrying capacity (K), there is no growth
- fastest growth rate at the inflection point (N = K/2)
- growth rate slows after the inflection point
* If N is greater than K, the population will decrease to reach K again
* If N is a lot smaller than K, the population will experience exponential growth
* If K increases when N remains the same, the population (N) will proceed to grow again until it reaches K again

Demography
The study of vital statistics and their change over time (such as age distribution)
Growing populations: more young people and less old people (pyramid shape)
Stable populations: equal amounts of older and younger people (sort of rectangle shape)
Declining populations: more old people and less young people (inverted pyramid or curvy vase shape)

Survivorship Curves
Type 1: Less likely to die young; more likely to die as they get older
Type 2: Constant death rate throughout lifetime
Type 3: Very likely to die young, but survivors live to be very old

Life Tables
An age-specific summary of the survival and reproductive rates within a population
Cohort
A group of individuals of the same age
Summary of Life Table Labels
x = age class (cohort)
lx = probability of survival from birth to age class
px = probability of survival to next age class (lx+1 / lx)
qx = probability of dying before next age class
mx = average # of offspring had by the age class
lxmx = average # of offspring taking mortality into account
nx0 = # of individuals currently in each age class
nx1 = # of individuals in the next age class (predicted)
Gross Reproductive Rate (GGR)
The total lifetime reproduction in the absence of mortality
- Sum of all mx
Net Reproductive Rate (R0)
Average number of individuals produced in its lifetime with mortality taken into account
- Sum of all lxmx
R0 > 1 (population increasing)
R0 < 1 (population decreasing)
R0 = 1 (population stable)
Giant pandas live for about 20 years in the moist bamboo forests of southwestern China. Beginning around age 6, females give birth approximately every two years. Offspring are tended by the female over the first 18 months of their life. What type of survivorship curve would the giant panda most likely have?
a. Type I
b. Type II
c. Type III
a. Type I
Parental investment in early life ensures the survival of the offspring, and they live pretty long lives.
To estimate how populations grow over time under ideal conditions, we use the _____ growth model for species that reproduce throughout the year and the _____ growth model for species that have limited breeding seasons. To depict the slowing growth rate of populations as the carrying capacity is approached, we use the _____ growth model.
a. exponential; logistic; geometric
b. geometric; logistic; exponential
c. exponential; geometric; logistic
d. logistic; exponential; geometric
e. exponential, logarithmic, geometric
c. exponential; geometric; logistic
If you begin with an initial population of 120 butterflies and annual growth rate is 0.8, how many butterflies will you have in 5 years? Please use the geometric growth equation and state your answer to the nearest whole number.
Nt = N0 * (λ^t)
N0 = 120
λ = 0.8
t = 5
120 * (0.8^5) =
39 butterflies
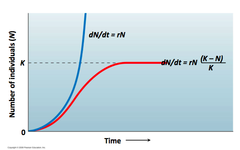
Refer to the graph. The size of a deer population in an enclosed, protected area was measured over several years and found to be following the blue (left) growth curve shown. After several years of drought, its population size more closely followed the red (right) curve.
What factor probably caused the change in the deer's population growth?
a. Emigration
b. Immigration
c. Genetic alterations
d. Food or water limitations
e. Flood or hurricane
d. Food or water limitations
Under ideal conditions, population growth can follow an exponential model. However, under less-than-ideal conditions, population growth will be limited by the amount of resources. The lack of food and water resources will cause the deer to reach the carrying capacity.
The following table shows the survival and fecundity of a flowering plant.
x = 1 2 3 4 5
px = 0.1 0.8 0.4 0.3
What is qx for age class 2?
a. 0.2
b. 0.08
c. 0.9
d. 0.5
e. 0.32
a. 0.2
if px of age class 2 is 0.8, and qx = 1 - px
1 - 0.8 = 0.2 = qx