Applied Stat Learning Midterm (copy)
 Call Kai
 Learn
 Practice Test
 Spaced Repetition
 Match
 Flashcards
 Knowt Play
1/51

There's no tags or description
Looks like no tags are added yet.
52 Terms
1. What kind of patterns do you search for with data visualization
Clusters , Outliers, other non-linear or linear patterns
Suppose you have a sample {𝑥1,…,𝑥n} from an unknown population. Provide a short algorithm for constructing a bootstrap confidence interval
for the population mean 𝜇,
Resample: Take N samples of size n, with replacement.
Means: Calculate the mean of each sample to form the bootstrap distribution.
Quantiles: Find the 2.5% and 97.5% quantiles.
CI: Calculate:
(2x̄ - q0.975, 2x̄ - q.025)
The percentile method gives a 95% confidence interval for the mean using the 2.5th and 97.5th percentiles of the bootstrap distribution. What assumptions are needed for this interval?
Random: The original sample is random and observations are iid (independently and identically distributed)
Representative: The sample represents the population.
Large enough: The sample size is large enough for the bootstrap distribution to approximate the sampling distribution accurately.
Symmetric: Population roughly symmetric with no extreme outliers
4. When do we use the bootstrap method instead of the percentile method?
When the bootstrap distribution is approximately symmetric but biased.
The basic bootstrap method adjusts the interval to help account for this bias.
New: When data distribution is symmetric use percentile method, if its skewed use bootstrap method
Supposed we have a binary response Y and a vector of predictors X. How would you define a linear classifier?

Is it possible that there might be a biased estimator with lower CV MSE than the Least squares estimator?
Yes (a biased estimator can), if the reduction in variance is greater than the increase in squared bias. Known as the bias-variance tradeoff.
7. Define the method of “leave one out” cross-validation
LOOCV is the method where we train a model on all observations except 1
and test it on the observation left out,
we repeat this process for every observation and
average the prediction errors to calculate the CV MSE.
Define the method of “ten fold” cross-validation.
Split data into 10 groups evaluate the response at each group while omitting the group to fit the prediction model.
Split into 10 groups, train model on 9, test on remaining, repeat and average prediction errors to get CV MSE
Define what we mean by partitioning the data into training and testing sets.
Training set is used to fit the prediction model
and the testing set is used to evaluate the performance of the model
Point out the difference between “training and testing sets” and cross-validation methodology in order to evaluate the performance of a method.
In CV all the data is reused in predicting other data
While in training–testing no data is reused.
Define cubic spline.
Is a piecewise third degree polynomial that passes by a set of points with continuous 1st and 2nd derivatives.
What are the basis functions for a cubic spline?
What are the basis functions for a cubic spline?
1 , X, X², X³ , (X-bi)³+ for i=1…k
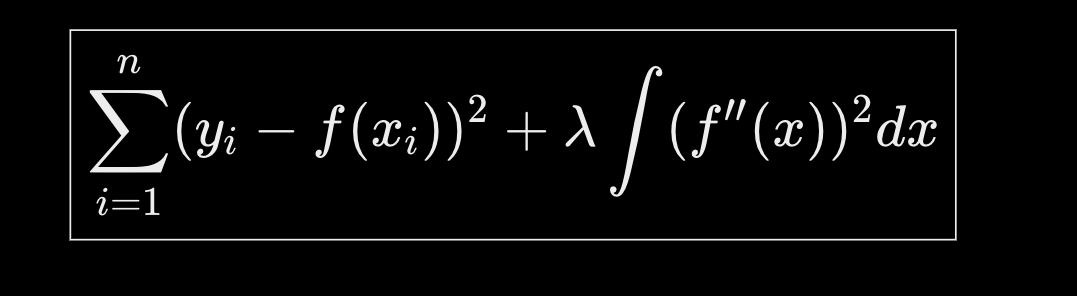
What is the penalty criteria for the method of smoothing splines?
Smoothing splines minimize the sum of squared errors plus a penalty for roughness, controlled by λ.
What are the basis functions for natural splines?

Give the form of the linear discriminant analysis method for predicting a
response Y with three possible values {“1”,”2”,”3”}. XXXXX not on
not on exam

Define Euclidean distance d(x,y) for x,y p-dimensional vectors. Sum( (xi – yi)²)1/2
The straight-line distance between x and y:

Define Manhattan distance d(x,y) for x,y p-dimensional vectors. Sum( |xi – yi|
the sum of the absolute differences:

What is the difference between unsupervised classification and supervised classification?
Unsupervised you don’t observe the response variable.
Supervised you observe the response.
Suppose that {𝑋1, … , 𝑋n} are n Bernoulli trials with P(𝑥i = 1) = 𝑝i) what are the conditions needed for S = 𝑋1 +. . . +𝑋n has a binomial distribution.
For S to have a binomial distribution:
-the trials must be independent,
-have only two possible outcomes (0 or 1)
-and have the same probability of success (p) for every trial, with a fixed number of trials (n).
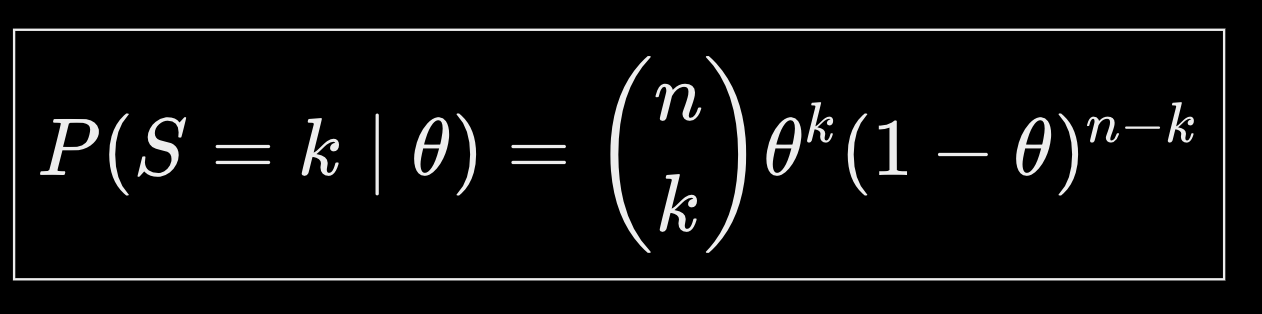
Suppose that S has a binomial distribution with parameter θ what is the P(S=k|θ)?
Suppose that S has a binomial distribution with parameter θ with prior distribution U[0,1]. What is the posterior distribution P(θ |S=k)?
Beta(k+1,n-k+1)
Suppose that S has a binomial distribution with parameter θ with prior distribution U[0,1]. Draw the posterior distribution P(θ |S=k).

Give the Beta probability distribution of a random variable z:

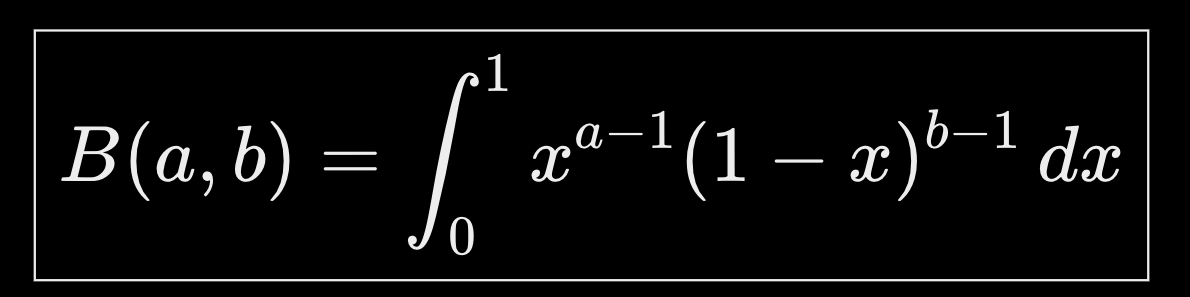
Define the Beta function B(a,b)
Suppose you have a sample {𝑥1,…,𝑥n} from a population. What are the k nearest neighbors of a point 𝑥?
are the k sample points closest to 𝑥, determined by a distance measure such as Euclidean distance.
Define the method of k-nearest neighbors’ regression for a continuous response Y?
For a point x, find the k nearest neighbors and Predict the mean of their y values, or fit a regression model on them. |
Define the method of k nearest neighbors’ classification for a binary response Y?
For a point x, find the k nearest neighbors and Predict the class that wins the majority vote among their responses, or fit a logistic regression on them. |
Suppose that we observe a data matrix X(𝑛 × 𝑝) of features and a response data vector Y(𝑛 × 1). Give the Least squares regression estimate β^ of β for this data.

What happens to β^ when 𝑛 < 𝑝 + 1?
When (n < p+1), β^ is not unique because there are more parameters than observations, so XTX is not invertible.
What is collinearity?
Collinearity is when the matrix X’X is nearly singular
Which method is used for avoiding collinearity?
Ridge regression
Give the constraint to the least squares estimating equations which produces the ridge regression estimator.
where t ≥ 0 is a constant.

Give the constraint to the least squares estimating equations which produces the LASSO estimator.
where t ≥ 0 is a constant.

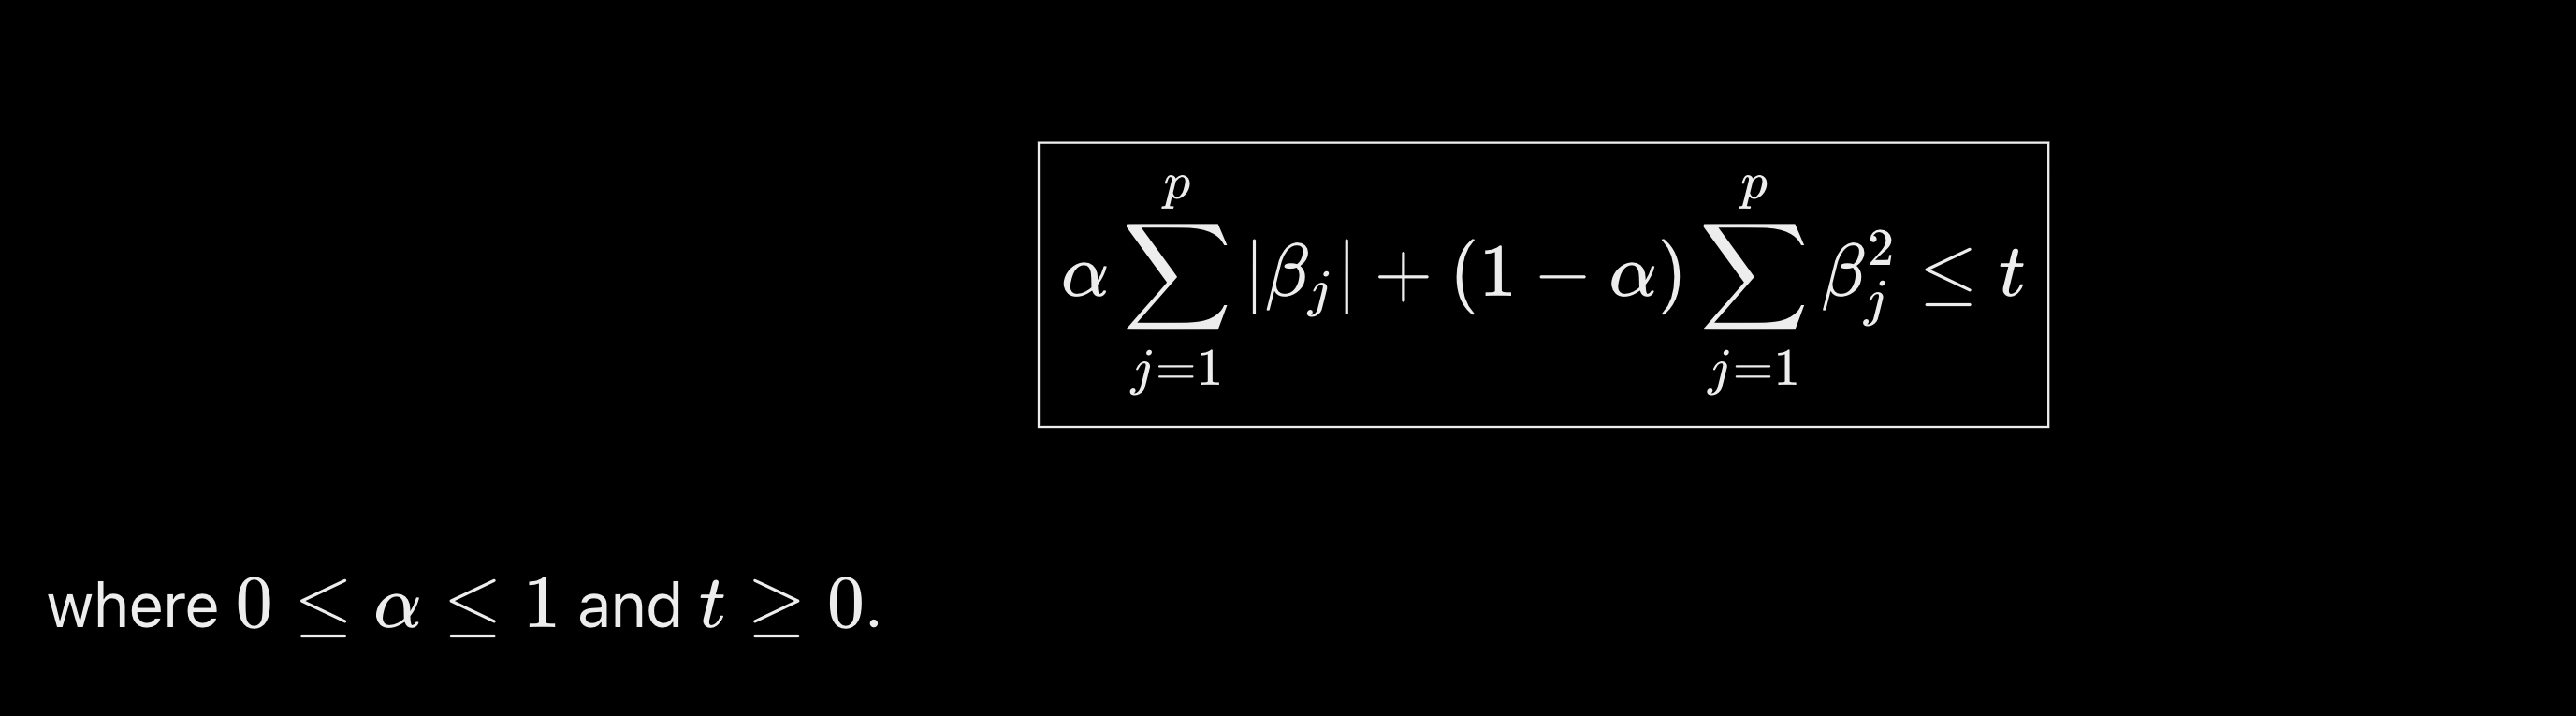
Give the constraint to the least squares estimating equations which produces the elastic net estimator.
How do we estimate 𝜆 in LASSO?
Use CV and choose the λ within one standard error of the minimum CV error.
How do we estimate 𝜆 in Elastic net?
Use cross-validation and choose the λ within one standard error of the minimum CV error, tuned together with α.
How do we estimate 𝛼 in Ridge Regression?
Use correlation. High correlation = low alpha, low correlation = high alpha
How do we estimate 𝛼 in Elastic net?
Use correlation. High correlation = low alpha, low correlation = high alpha
What is Variable selection?
Process of choosing the most relevant predictor variables to include in a model.
Give 4 methods that can be used to perform Variable selection.
Forward Selection:
Backward Elimination:
All Subsets Selection:
LASSO Regression:
What is all subsets selection?
Fit all 2p models,
pick the best of each size k by MSE,
then choose among those using the lowest Cp, AIC, or BIC.
Give an example of Simpson’s paradox
Simpson’s paradox occurs when a trend appears in separate groups but reverses when the groups are combined.
A player can have a higher batting average than a teammate in every single individual season, yet end up with a lower combined multi-year batting average if they had fewer at-bats during their best seasons
If histogram of a feature is very skewed to the right and the values are all greater than 0. Give a simple transformation that may work to reduce skewness.
Apply a log transformation to reduce right skewness.
Y = log(X)
Draw a picture of the logistic curve

Write down the Logistic regression model
log( p / (1 − p) ) = β′x
Write down the Probit regression model.
Φ⁻¹(p) = β′x
Φ = normal CDF.
Which method do we use to estimate the parameters of a logistic regression model?
Maximum Likelihood Estimation (MLE)
Is there an explicit solution for the MLE of the logistic regression parameters? How do I estimate them?
No. Estimate them with a method such as steepest descent.
What is the Steepest descent optimization method?
A method that minimizes a function by repeatedly moving in the direction of the negative gradient, the direction of steepest decrease.
Define SVM and give the SVM classifier equation.
SVM: finds the separating hyperplane with the maximum margin.
Classifier:
add hats!!!!

Define the margin of a Support Vector Machine classifier and give its value as a function of beta the vector parameter of the SVM classifier equation.
Separation between the two classes. 2 / |beta|
Define the Kernel method for function approximation
