3.3.1 revenue
 Call Kai
 Learn
 Practice Test
 Spaced Repetition
 Match
 Flashcards
 Knowt Play
1/9

There's no tags or description
Looks like no tags are added yet.
10 Terms
What is the formula for TR and what is it?
TR= PxQ
TR is the total amount of money coming from the sales of goods and services.
What is AR?
AR= P= TR/Q
AR is revenue per unit until AR is the D curve
What is MR?
MR= △TR/△Q
MR is the extra revenue from selling one more unit.
What is perfect competition?
Perfect competition is a market structure where many small firms sell an identical product, and no firm can influence the price. e.g foreign exchange markets.
What do firms in perfect competition experience?
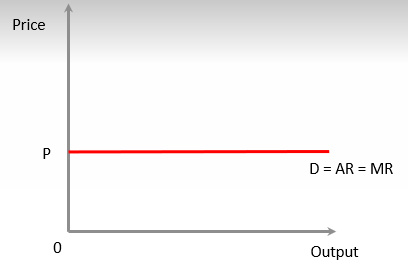
Firms in perfect competition experience a perfectly elastic demand curve. These firms have no price setting power. Each firm can sell all of its output at the current market price, P. Therefore, it would not lower its price. If it were to raise price it would sell nothing as buyers would go to another seller. Thus, the D curve is horizontal. The TR curve is upward sloping as prices are constant, so more goods sold→ more revenue.

Why is the D curve in perfect competition also the AR and MR curve?
The D curve is also the AR curve as total output divided by price is always the same.
The D curve is also the MR curve. As prices do not change, an additional unit sold will bring in the same revenue every time.
What is imperfect competition?
Imperfect competition describes any market structure where firms have some control over price because products are differentiated or there are few sellers.
Examples:
Monopolistic competition: restaurants, hairdressers.
Oligopoly: supermarkets, mobile phone networks.
Monopoly: Royal Mail (letters), local water suppliers
What do firms in imperfect competition see?
Firms in imperfect competition see:
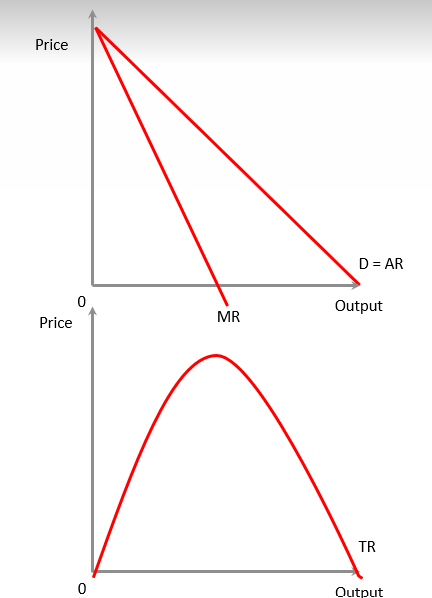
a downward sloping demand curve. The D curve is also the AR curve, as it indicates the price that consumers are willing to pay for each quantity sold. They have some price setting power.
The MR curve will fall twice as steeply as the AR curve. To sell an extra unit the firm has to lower price. However, this means it must lower price for all units.
The TR curve peaks when MR = 0. At this point TR is maximised.
When MR is above 0 each additional unit sold adds to TR.
After this point we have negative marginal revenue. TR will fall.
How is elasticity shown in imperfect competition?
Price elasticity changes as we move down the demand curve.
At higher prices a change in price leads to a greater change in demand.
At lower prices a change in price leads to a smaller change in demand.

How is the elasticity of the curve linked to MR?
If MR is +ve, when the firm sells at a lower price(or when they increase output), TR still grows, so D curve is elastic. Until output Q, demand curve is elastic.
If MR is -ve, TR decreases as prices decreases (or output increases), so D curve is inelastic. After output Q, D curve is inelastic.
When MR=0, TR is maximised and the D curve is unitary elastic (point Q)
