Own-price effects and welfare
 Call Kai
 Learn
 Practice Test
 Spaced Repetition
 Match
 Flashcards
 Knowt Play
1/11

There's no tags or description
Looks like no tags are added yet.
12 Terms
What are the two effects that occur from an own-price change?
Substitution and income effects. The sum of these is the total effect on the consumer.
What is the substitution effect?
When an increase in the price of the good itself means that it is relatively expensive compared to alternatives so demand decreases for the good.
This effect always negative when prices increases, assuming convexity.
What is the income effect?
When the increase in own price good means that current income can buy less of the good (real income/purchasing power reduced).
The effect is different depending on the type of good:
Normal good - Price increases, real income decreases so demand for good decreases
Inferior good - Price increases, real income decreases hence demand for good increases.
Note that for an ordinary good, a price increase always leads to the total effect being negative, even if the income effect is positive.
Sub and income effects on diagram for price increase
graph of good x on horizontal and good y on y vertical
Originally at e1, consuming 12 units of x
price increases reducing consumption to 6 units, meaning the total effect is -6, sum of inc and sub effects
sub effect is shown by shifting the e2 curve parallel to the original ic, so original utility is preserved whilst consumer faces new prices
Then inc effect sets in, shown by e2 equlibrium

What is the Slutsky equation?
ε = ε *- ηθ
ε = price elasticity of demand (total effect)
ε *= Substitution price elasticity (Sub effect)
η = Income elasticity of demand (income effect)
θ = Budget share spend on the good (qipi/M)
Law of demand from Slutsky’s equation
For a normal good:
Substitution elasticity ε * < 0
Income elasticity η > 0
Budget share spent on good θ > 0
So we always get a negative - positive in the slutsky equation which always sums to a negative (ε < 0)
Meaning when the price of good increases, demand decreases which is the law of demand.
Income and budget share on good significance in slutsky equation
ηθ makes up the income elasticity of demand, which tells us two things:
When η (income elasticity) is close to 0/small, then a change in real income has little effect on demand.
When θ (expenditure from budget on good) is small, there is only little part of budget being spent on good, hence purchasing power isn’t affected much.
What is the consumer surplus?
This is the difference in what the consumer is willing to pay and what they actually pay.
The demand curve represents consumers’ willingness to pay for each unit.
So the surplus is below the demand curve but above the market price, up to the quantity purchased.
What is compensation variation?
This is the amount of additional income needed to restore utility of the original curve after a price increase.
CV diagram explained
Initially consumer at e1, with ic1 and budget constraint (blue) in tangent
Price increase in x means that the constraint pivots inwards, whilst amount of y remains the same, with a new indifference curve ic2 and equilibrium e2
We now make the constraint tangent to the original curve ic1, cv shows how much additional income is needed to reach the original equilibrium and utility

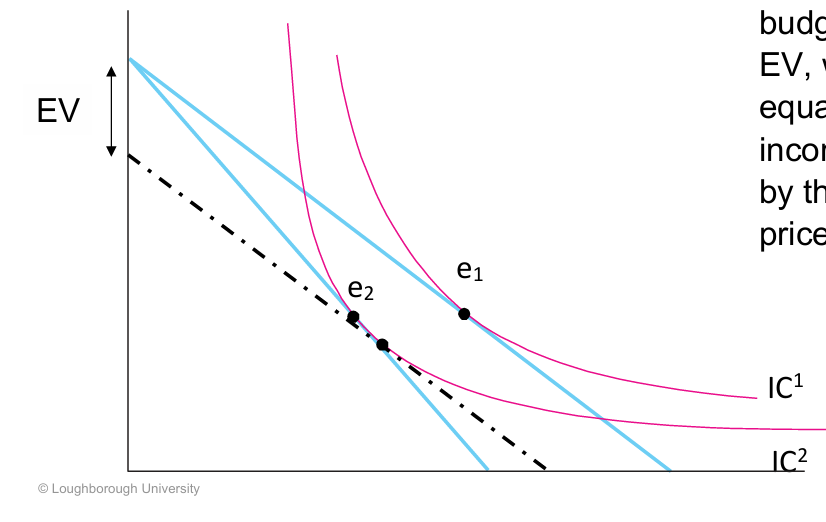
What is equivalent variation?
The amount of income needed to be taken away before a price increase which would be equivalent to the utility reduction.
EV diagram explained
original equilibrium of e1, with ic1 and budget constraint in tangent
Price increase means constraint pivots inwards with new equilibrium e2, with ic2 and constraint in tangent
We then reduce the consumer’s income whilst keeping the original prices, so the dashed line parallel to original curve while being in tangent with second ic curve.