Stats Test 2
 Call Kai
 Learn
 Practice Test
 Spaced Repetition
 Match
 Flashcards
 Knowt Play
1/92

Earn XP
Description and Tags
Stressed
93 Terms
What does Binomial Distribution do?
Binomial Distribution calculates the probability of getting a certain number of successes in a fixed number of attempts.
We repeat the same experiment multiple times.
Ex. “What is the probability of getting exactly 3 heads out of 5 coin flips?”
What are the conditions for using Binomial Distribution?
Fixed Trials (you know how many attempts)
Two outcomes (each attempt is a success OR fail)
Independence (one attempt doesn’t impact the other)
Same probability (the probability of success stays the same)
Look at the equation in your sheet (Binomial Distribution). What is y?
The number of successes we want
Look at the equation in your sheet (Binomial Distribution). What is n?
The total number of trials
Look at the equation in your sheet (Binomial Distribution). What is p?
The probability of success
Look at the equation in your sheet (Binomial Distribution). What is 1-p?
The probability of failure.
Look at the equation in your sheet (Binomial Distribution). What is n-y?
The number of trials minus the number of successes
What does Geometric Distribution do?
It calculates the probability that your FIRST success happens on a specific attempt
When do you know to use Geometric Distribution?
When we want to solve how many attempts it will take until the first success.
Ex. What is the probability that the first heads occurs on the third flip assuming p(heads = 0.5)?
Look at the equation in your sheet (Geometric Distribution). What is p?
The probability of success
Look at the equation in your sheet (Geometric Distribution). What is 1-p?
The probability of failure
Look at the equation in your sheet (Geometric Distribution). What is y?
The attempt on which the first success occurs
Look at the equation in your sheet (Geometric Distribution). What is y-1?
The number of failures before the first success
What conditions must be met to use Geometric Distribution?
You repeat the same experiment until the first success
Each attempt has only 2 outcomes: success of failure
Each attempt is independent with the same probability of success
What is the key difference between Binomial distribution and Geometric distribution?
Binomial distribution may have multiple successes, and Geometric stops at the first success
What does Hypergeometric Distribution do?
It calculates the probability of getting a certain number of successes when selecting from a group, WITHOUT REPLACEMENT
What are the conditions for using Hypergeometric Distribution?
You have a fixed population (group of items)
Each item is either a success or a failure
You select items without replacement
Look at the equation in your sheet (Hypergeometric Distribution). What is N?
The total number of items
Look at the equation in your sheet (Hypergeometric Distribution). What is r?
The total number of successes in the group
Look at the equation in your sheet (Hypergeometric Distribution). What is n?
The number of items selected
Look at the equation in your sheet (Hypergeometric Distribution). What is y?
The number of successes you WANT
What does Poisson Distribution do?
It calculates the probability of a certain number of events happening within a specific period of time
What are the conditions for using Poisson Distribution?
The number of times an event occurs is counted
A specific interval is given (time, distance, area)
Events occur independently
The average rate stays consistent
Look at the equation in your sheet (Poisson Distribution). What is y?
The number of events you want
Look at the equation in your sheet (Poisson Distribution). What is lambda?
The average number of events in the interval
Look at the equation in your sheet (Poisson Distribution). What is e?
Euler’s number
What does Negative Binomial Distribution do?
It calculates the probability of the nth success after a specific number of trials
What are the conditions for using Negative Binomial Distribution?
Two possible outcomes: success or failure
Independent trials
Same probability (success p stays the same)
Fixed # of successes (you continue until your nth success)
Look at the equation in your sheet (Negative Binomial Distribution). What is y?
The total attempts needed
Look at the equation in your sheet (Negative Binomial Distribution). What is r?
The number of successes we want
Look at the equation in your sheet (Negative Binomial Distribution). What is p?
The probability of success
Look at the equation in your sheet (Negative Binomial Distribution). What is y-r?
The number of failures
What is the key difference between Binomial Distribution and Negative Binomial Distribution?
Binomial Distribution - A binomial distribution doesn’t care about WHEN the final success happens
Negative Binomial Distribution - The nth success MUST BE LAST
What does Uniform Distribution do?
It calculates the probability that a randomly selected value falls within a specific range.
All values in the overall range are equally likely
What are the conditions for using Uniform Distribution?
There is a minimum value and a maximum value
Every value in the interval has the same probability density
Values outside the interval have a probability of 0
Look at the equation in your sheet (Uniform Distribution). What is a?
The minimum value
Look at the equation in your sheet (Uniform Distribution). What is b?
The maximum value
Look at the equation in your sheet (Uniform Distribution). What is y?
The value between a and b
What is the key difference between Uniform Distribution and Poisson Distribution?
Poisson Distribution - Uses averages over an interval
Uniform Distribution - Uses an equally likely range over an interval
For Uniform Distribution, what’s the significance of 1 being in the numerator?
The 1 in the numerator represents the probability that it will happen (100%). So solving the equation as is will give us the probability density.
To calculate the probability we will replace the numerator.
For Uniform Distribution, when should 1 NOT be in the numerator?
What should we replace it with?
When we want to calculate the probability instead of the density.
We replace the numerator with the desired length of time (max - min)
For Uniform Distribution, what does it mean when we get the probability density?
The probability an event will occur in 1 interval.
(The interval in question after its been distributed equally throughout the whole interval)
If we are looking for 5 minutes (vs 1 minute) we would multiply the probability density by 5 and then by 100 to get the percent an event will occur within the 5 minutes.
What does Normal Distribution do?
Tt calculates the probability that a value falls within a certain range
Look at the equation in your sheet (Normal Distribution). What is μ?
The average (the very center of the curve)
Look at the equation in your sheet (Normal Distribution). What is σ?
The standard deviation (how spread out the data is)
Look at the equation in your sheet (Normal Distribution). What is y?
The value we’re solving for
What does PDF do?
It calculates the height of the bell curve at a specific value.
Why do we care about the height of a curve at a specific point (PDF)?
It helps us determine the probability over an interval
What does it mean if the curve from PDF is short?
There are few scores concentrated on that given area.
What does it mean if the curve from PDF is tall?
There are many scores concentrated on that given area.
When do we use CDF?
When we are calculating a probability that is less than or equal to a specific value
What is the formula for the z value?
What does y represent?
z = y-μ/σ
y is the value you’re interested in
What does the z value represent?
It tells you where a value falls relative to the average
Example: A z value of 1 tells us that the value we were solving for falls 1 standard deviation above average
What does Exponential Distribution do?
It calculates the probability of how long you wait for something to happen
True or False: CDF and PDF formulas are the same for every distribution type
False
Probability density VS Event Rate
The Event Rate tells us how often an event is to occur
The probability density tells us how likely an even event is to occur
What is the Multiplicative Law of Probability (Dependent)?
Find the probability of the first event.
Multiply it by the probability of the second event, GIVEN that the first event happened.

What operator do you expect to see for the Multiplicative Law of Probability?
AND
True or False: You can use the Multiplicative Law of probability for both dependent and independent events
True
What is the Multiplicative Law of Probability (Independent)?
You multiply the two events

What is the Additive Law of Probability (with overlap) (not mutually exclusive))?
Add the probability of A.
Add the probability of B.
Subtract the probability of both

For the Additive Law of Probability why do you subtract the probability of both events occurring (not mutually exclusive)?
You subtract BOTH happening so you don't count it twice.
What operator do you expect to see for the Additive Law of Probability?
OR
What is the Additive Law of Probability (without overlap) (mutually exclusive))?
You just add the probabilities

What key word do you expect to see when computing the probability of a complement?
NOT
Other keywords when computing for the complement
NOT happening
At least one
None
Does not occur
What are the three rules of a partition?
No overlap: Events cannot happen together.
Exhaustive: Every possible outcome belongs to a group.
Add up to 1: All group probabilities must equal 1 when added.
Why are partitions important?
They are helpful for the Law of total probability
What is a partition?
A partition is dividing the entire sample space into separate groups that cover everything.
What is the Total Law of Total Probability?
The Law of Total Probability helps us find the probability of an event by breaking it into different possible groups or scenarios.
Find the probability of A by considering all the different ways A can happen

What do you do when you use the Law of Total Probability?
Find the probability of being in group B AND event A happening.
Find the probability of being in group Bᶜ AND event A happening.
Add them together.

What types of problem hint at the usage of the law of total probability?
Divide people or objects into different groups.
Give different probabilities for each group.
Ask for the overall probability of an event.
What is the difference between the Law of Total Probability and Bayes Rule?
Total Probability: What's the chance a product is defective?
Bayes' Rule: Given that the product is defective, what's the chance Factory A made it? You already know WHAT happened. Now you want to figure out WHERE it came from or WHY it happened.
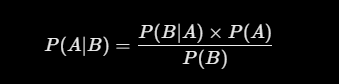
What is Baye’s Rule?
Left:
(P(A|B)): Probability of A given B. (What we're trying to find)
Numerator:
(P(B|A)): Probability of B given A.
(P(A)): Original probability of A.
Denominator:
(P(B)): Overall probability of B.
What does DRV stand for?
Discrete Random Variable
What is a Discrete Random Variable?
Takes countable values.
Usually whole numbers.
Example: Number of students in a classroom (0, 1, 2, 3...).
What is a Continuous Random Variable?
Can take any value within a range.
Can include decimals.
Example: A person's height (5.2 ft, 5.25 ft, 5.253 ft...).
What does CRV stand for?
Continuous Random Variable
What is Variance?
Variance tells you how much the values differ from the average
What does the Probability Function for DRV do?
The probability function is just a list of all possible outcomes and their probabilities
Expected Value for DRV
The expected value is the average outcome we would expect if we repeated an experiment many, many times.
A weighted average.
Variance Formula for DRV?
x is the expected value

When do you use Variance for DRV?
You use variance for a DRV when a question asks how spread out the possible outcomes are around the expected value (average)
In the Variance for DRV formula, what is the Expected value?
The expected value for the variance for DRV is the weighted avg
What is the Standard Deviation for DRV?
The square root of the variance
What is a Bernoulli Trial?
A Bernoulli trial is a single experiment that has exactly TWO possible outcomes:
Success
Failure
Steps for CDF/PDF TI84
Press
2ndPress
VARS(DISTR)Scroll down to desired
Press
ENTER
What are the values in Binomial PDF TI84?
n = Number of trials
p = Probability of success
x = Number of successes you want
What are p and x in Geometric PDF TI84?
(p) = probability of success on each trial.
(x) = the trial number you're checking.
What are percentiles?
Percentiles tell us where a value falls compared to everyone else in a data set.
Think of percentiles as a way of ranking data.
For example, imagine you take a test with 100 students.
50th percentile: You scored higher than 50% of students.
75th percentile: You scored higher than 75% of students.
90th percentile: You scored higher than 90% of students.
25th percentile: You scored higher than 25% of students.
The important thing to remember
A percentile tells you what percentage of values fall at or below a certain value.
How do we calculate the Expected Value for CRV?
What is the integral?
We use integrals

What do the variables in the integral for Expected Values for CRV mean?
(x) = possible values of the random variable
(f(x)) = probability density function (PDF)
(int) = adds up the weighted values across a continuous range

Variance for CRV, what does it mean?
