Soc120
 Call Kai
 Learn
 Practice Test
 Spaced Repetition
 Match
 Flashcards
 Knowt Play
1/7

Earn XP
Description and Tags
20's, 50's, most current data, overall trend
8 Terms
median age at marriage
20’s- 24(m), 21(f)
50’s- 21(m), 20(f)
currrent- 31(m), 29(f)
with the exception of the 50’s, the marriage age has been increasing

Marriage rates (per 1000 population)
20’s- 12/1000
50’s- 16.5/1000
current- 6.5/1000
upward trend until the 50’s, drop in the 30’s (depression) and spike in the 50’s, overall downward trend since 50’s

Divorce rates (per 1000 population)
20’s- <2%
50’s- 3%
current- 3.5%
overall upward trend, spike after WWII (due to hasty marriages, infidelity, post-war ptsd, etc.)

total fertility rate (children per woman)
20’s-3.2
50’s-3.6 (almost 4)
current-2
overall downward trend, dip in the depression, spike in the post-wwii baby boom, black population have higher fertility rate than avg, hispanic population is higher still

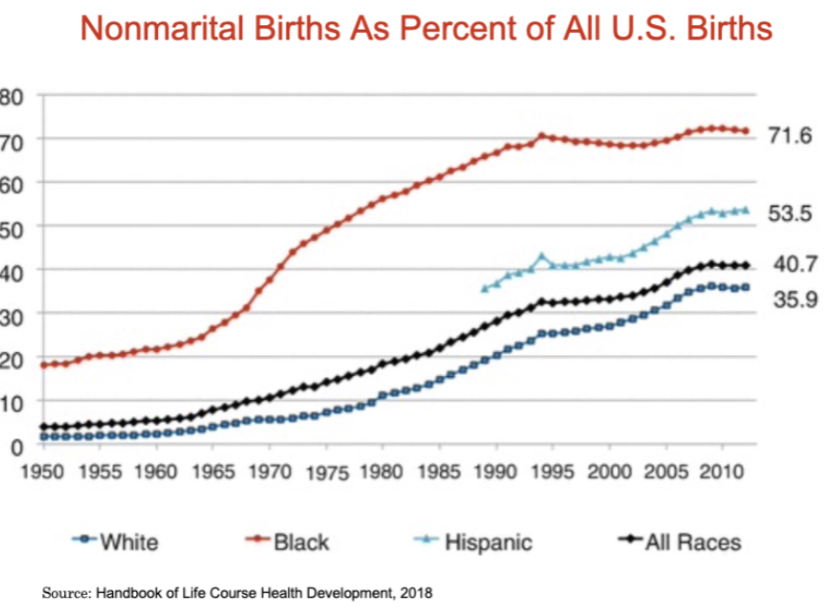
nonmarital births (% of all births)
20’s- no data
50’s- 5%
current- 40.7%
overall upward trend, black population have highest rate (by 30%), white population has lowest rate, US is in middle of international rate
% of >18 living in 4 family types
No parent- 5% throughout history
two-parent farm- downward trend
breadwinner/homemaker- incline since industrial revolution, sharp decline since 60’s
dual-earner/single parent- low until sharp incline in 40’s
Living arrangements of children
two parent- decline from 85% in 60’s to roughly 70% since 90’s
mother only- increase from 10% in 60’s to roughly 20% since 80’s
no parent or father only- ≤5%
(most single mothers are black, then hispanic, then white)
labor force participation rate
men- decrease since 85% in 50’s to 65% (hispanic>asian>white>black)
woman- increase since 32% in 50’s to 60% now (black>hispanic>asian>white)