math day 17 sampling distributions
 Call Kai
 Learn
 Practice Test
 Spaced Repetition
 Match
 Flashcards
 Knowt Play
1/12

There's no tags or description
Looks like no tags are added yet.
13 Terms
Population distribution
The probability distribution of a measurement in the population.
• It describes the possible values of the measurement and their probabilities.
The population distribution is typically ______, but it may be
______ for statistical analysis.
known, assumed or modeled
parameter
numerical summary of a population
Mean(μ), proportion(p), standard deviation(σ), variance(σ²)
statistic
numerical summary of a sample
Mean(x̄), proportion(p̂), standard deviation(s), variance(s²)
random sample
They are independent of each other;
2. Each observation has an identical distribution to the population.
independent and identically distributed sample
a sample that is both
1. They are independent of each other;
2. Each observation has an identical distribution to the population.
Sampling distribution
The probability distribution of the possible values of a sample statistic.
sampling distribution role in inferential statistics
The sampling distribution plays a central role in inferential statistics because it describes the behavior and variability of a sample statistic across repeated samples.
Sampling Distribution of Sample Mean
o The true population mean μ is out there, but in most cases, it isn’t feasible to know it.
• We may not have enough time or money to poll the population
o The true population mean μ is out there, but in most cases, it isn’t feasible to know it.
• We may not have enough time or money to poll the population
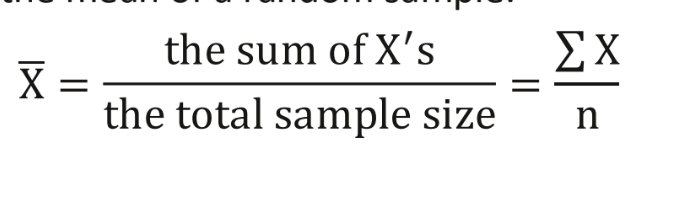
Sampling Distribution: Mean
Suppose the population mean and standard deviation are μ and σ.
o The mean of “the sampling distribution of the sample mean” will
always equal the population mean:

Sampling Distribution: Mean and SD
The standard deviation of “the sampling distribution of the sample
mean” will equal the population standard deviation over the square
root of the sample size n:
We also call this standard error of xത.

the sampling distribution for a sample mean follows a normal distribution with mean μ and standard deviation σ/√n: =

Central Limit Theorem (C. L. T.)
when n is large (n ≥ 30), the distribution of Xbar is approximately normal with mean μ and standard deviation σ/ n:
In short, the distribution of Xഥ is approximately normal when n is large (n ≥ 30), regardless of the population.