(3) precipitation
 Call Kai
 Learn
 Practice Test
 Spaced Repetition
 Match
 Flashcards
 Knowt Play
1/48

There's no tags or description
Looks like no tags are added yet.
Name | Mastery | Learn | Test | Matching | Spaced | Call with Kai | Chat |
|---|
No analytics yet
Send a link to your students to track their progress
49 Terms
why measure precipitation?
to understand:
historical average
seasonal to annual
or common period
of water cycle and its impact on the environment
what is a return period?
used to estimate how much rain falling in a given time-period will produce stream flooding
how long it will be between rainfall events of a given magnitude
→ streamflow & ppt relationship
types of rainfall ground-based measurements: rainfall
manual gauges:
rainfall depth = (volume/area of orifice)
tipping bucket gauge:
intensity of rainfall measured (number of tips)
weighing gauge:
mass → volume (using density) → rainfall depth (mm) (using area)
converts the increase
con: wind
ground-based measurements: snowfall
snow falling into gauge must be melted (be heated)
tipping bucket gauge:
heated shelter (e.g., propane)
weighing gauge or water level gauge
heated rim, storage reservoir filled with antifreeze
snow/storm boards (NON MELTED)
accumulation of snow on board → snow depth = h2
ground-based measurements: snow water equivalent (SWE)
convert snow depth → water equivalent using an assumed snow density (ps): typically 100 km/m3
→ (snow has many possible densities → convert to standard (water depth)
!!! SWE = (ps/pw)h2
→ (ratio of snow density & water density) × new snow depth
SWE → snow density (ps)
SWE = (p2/pw)h2
→ ps = Ms / Vs
where:
Ms = mass of snow (kg)
Vs = volume of snow (m3)
= 𝛑r2h2
→ typically 100 km/m3 (not always, not a constant)
SWE → density of water (ρw)
SWE = (p2/pw)h2
ρw → constant = 1000 kg/m3
another way to find SWE using volume and area (ratio)
SWE = Vw/As
Vw = volume of liquid water (melted snow)
As = cross-sectional area of sampler
ground-based measurements: ultrasonic snow depth sensors
measures total snow depth (Hs) by measuring time required for a sound pulse to reflect off the snow and return
how long a round trip takes
→ measures how much snowpack grows
→ use increase in Hs to determine hs then estimate SWE
then uses assumed snow density to estimate how much water that new snow contains
NON MELTED
ground-based measurements: types of error
systematic: errors consistently in one direction; either over or under estimate (accumulate through time)
random: errors unpredictably in either direction; tend to cancel out over time (over and underestimate)
ground-based measurements: wind effects
change in turbulance
wind more dangerous for snow
snowfall much more sensitive (alters true measurements of snow catch as wind speed increases)

wind effect solution: wind shields
calms particles around openings → allows to be more percise
types of wind shields:
alter, nipher, combination, wyoming

ground-based measurements: other considerations/problems
evaporation: water collected can evaporate before measured (underestimate) → add veg oil for protective layer
wetting: some rainwater sticks to funnel surface due to adhesion (underestimate)
measurement height:
lower gauge: less wind so more accurate but water can splash from ground in (overestimate)
higher gauge: less splash-in but stronger wind (underestimate)
site characteristics
location of gauge → open area best
radar measurements of ppt
emits electronic radiation with wavelengths in 1cm-10cm range
waves are backscattered when they hit precipitation
radar measures power of returning signal (& particle size)
→ allows for larger area
→ doplet size and ppt amount measured… intensity/speed of droplets

radar challenges
Rain gauge bias: Errors in rain gauge measurements also affect radar accuracy when calibrating it
Snowfall: Snowflake shapes vary, making snowfall harder to estimate than rainfall
Melting snow: Melting snowflakes reflect strong radar signals, creating a misleading bright band
Topographic obstacles: Mountains and other obstacles reflect radar signals, creating unwanted signals called clutter
ppt mapping methods (2)
manual drawing of isohyets
grid-based mapping
→ to visualize ppt distribution across an area
manual drawing of isohyets
contour lines → connecting points having equal ppt
→ assuming the same amount of ppt has fallen across a contour

grid-based mapping
lay grid over area
at each grid point, estimate ppt based on surrounding measurements
e.g., using inverse distance-weighted averaging → estimate ppt at each grid by combining measurements from rain gauges using weights, often giving closer gauges more influence
grid-based mapping (ppt) ex. PRISM
displays pattern of ppt over large area based on topography → elevation alters levels
higher elevations have better quality measured data cause less clutter and closer to satelite
what does point scale to distributed scale mean?
Using point measurements from individual rain gauges to estimate average precipitation across an entire catchment (distributed scale)
→ spatial integration of ppt covered next.. 4 methods
spatial integration of ppt
→ calculating actual average of ppt based on found measurements (averaging ppt accross an area)
Arithmetic averaging: Average all rain gauge measurements equally (every gauge equal weight)
Thiessen polygons: Weight each gauge's measurement by the area of its polygon.
Isohyetal integration: Use precipitation contour lines and the area between them.
Grid-based integration: Estimate precipitation at grid points and average them.
arithmetic averaging
calculate average ppt by adding measurements from all rain gauges then divide by number of gauges

theissen polygons
divide catchment into areas where every point is closest to one particular rain gauge → estimating average ppt over catchment by weighting each rain gauge measurment according to area of its polygon

isohyetal integration
estimates average catchment ppt by weighting the average ppt between adjacent isohets by their area
Draw isohyets (contour lines connecting locations with equal precipitation).
Calculate the average precipitation between each pair of adjacent isohyets.
Multiply each average precipitation value by the area between those isohyets.
Add the results and divide by the total catchment area.

what is an isohyet?
line on map that connects points receiving the same amounts of ppt over a specific period
help estimate average ppt accross an entire watershed
grid-based integration
estimates average catchment ppt by averaging ppt values estimated at grid points within the catchment → each grid point is given equal weight in the average
Divide the catchment into a grid.
Estimate precipitation at each grid point using nearby rain gauge measurements.
Add the estimated precipitation values.
Divide by the number of grid points to find the average.
→ use measurements outside of catchment boundary to calculate a normal ratio

point scale vs distributed scale
point: measures ppt at one location using rain gauge
distributed: estimates ppt across an entire watershed
→ why different?
ppt varies between locations
elevation, mountains, and storm patterns affect rainfall
single rain gauge doesnt represent entire watershed
spatial variability in ppt
Elevation: Precipitation can vary with altitude.
Topography: Mountains affect precipitation patterns.
Storm patterns: Some areas receive more rain than others.
Wind: Can affect how much precipitation a gauge collects.
ppt significance
driving variable of hydrologic cycle → input in waterbalance
spatial and temporal variability of ppt reflect geographic variations in underlying processess
need qualitative understanding of underlying processes and resulting patterns
ppt requirements
saturation of the air
condensation (of water vapour to form ice crystals and/or droplets → condensation nuclei)
growth of droplets to size sufficient to fall to ground level b4 evaporating
continued input of water vapour to sustain process (depends on vertical wind and humidity)
SATURATION OF AIR
add moisture to air
cool air to the point of saturation
positive relationship of saturation and air temp
→ as temp increases, water held increases, saturation increases (warm absorbs)

saturation: how does uplift work as a cooling mechanism
air parcel rises, pressure decreases → expands parcel and starts cooling
for unsaturaed air: parcel cools at “dry adiabatic lapse rate” ~9.8°C/km
once saturated → release of latent heat by condensation reduces rate of cooling
→ uplift towards cooler temps cools air/water vapour
→ warm rises above cooler air → difference in density (hot air balloon)

Why does uplift cause cooling?
Rising air experiences lower atmospheric pressure, so it expands and cools
→ Cooling increases relative humidity, but the air only becomes saturated when it reaches 100% relative humidity
uplift as a cooling mechanism: ways to saturate air
convection
convergence (non-frontal)
convergence (frontal)
orographic processes
convection
warm, moist air rises
density of warm is less than of cold air → rises above (hot air balloon)
sources of heat & energy: ground, sun, human activities (often driven by solar radiation)

characteristics of convective ppt
mid-latitidues
spatial pattern: scattered cells (in horizontal extent)
1-10km
minutes to an hour (relatively shorter)
HIGH INTENSITY!
convergence (non-frontal)
air moving via rotation of earth & etc. → air masses colliding
where do they go? → up (convergence!)
ex. tropical cyclones (hurricanes) from tropical zones → move towards land mass
→ intertropical convergence zone

convergence (frontal)
extratropical cyclones
cold front vs warm front
convergence of different air masses from different climates FS
→ driven by different temp & density of air masses
cold air pushes warm air up

orographic processes (5)
upward deflection: air forced over topographic barriers (pic)
orographic agumentation of other lifting mechanisms
frictional effects → increased duration of storms
topographic convergence
seeder-feeder mechanism
→ prevailing winds from ocean, air mass rises over hill, interacts with landscape → friction & slows → increased storm duration (slowed down)
orographic process 1
upward deflection: air forced over topographic barriers

orographic processes 2&3
ex. atmospheric river
heavy rain/snowfall
moisture originates from ocean (hawaii)
convection/convergence → hit mountains (friction) → orographic
→ this is the orographic augmentation of other lifting mechanisms
→ friction increases storm duration
orographic process 4
topographic convergence
landscape funnels air around/through channels → convergence
stand-alone mountain range surrounded by water → moisture coming through pacific coast will move around mountain range then meets back together → convergence
moves around easiest path

orographic process 5
seeder-feeder mechanism
blowing moisture into the air

CONDENSATION
keep adding water to air for it to condense → cloud
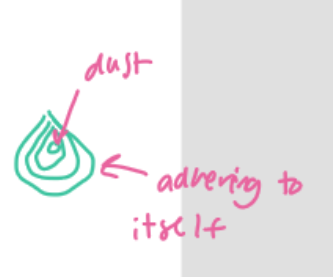
condensation of water vapour to form ice crystals and/or droplets → condensation nuclei
clings onto other stuff in the air like ash, dust, soil
GROWTH
growth of droplets to a size sufficient to fall to ground level before evaporating
existing water molecules run into one another (collision & turbulance) → grows then falls
CONTINUED INPUT
cont. input of water vapour to sustain process (depends on vertical wind and humanity)
needs a source of water to continue (ex. into storm system)
spatial and temporal ppt are a function of what? (ppt patterns)
climate and topography
patterns in space and time (where and when)
elevation variation
rain shadow effect
dry part after moisture has fallen
interactions between topography and weather systems
lake effect
seasonal variations
what is lake effect (ppt patterns)
cold air masses pick up moisture and heat over warmer lakes
friction and topographic effects of lee of lake create convergence → small scale atmospheric river