Supply Chain Exam #1
 Call Kai
 Learn
Learn Practice Test
 Spaced Repetition
 Match
Match Flashcards
 Knowt Play
1/90

There's no tags or description
Looks like no tags are added yet.
Name | Mastery | Learn | Test | Matching | Spaced | Call with Kai | Chat |
|---|
No analytics yet
Send a link to your students to track their progress
91 Terms
Supply Chain Management
Encompasses the planning and management of all activities involved in sourcing/procurement, conversion, and all logistics management activities - including coordination and collaboration with channel partners (suppliers, intermediaries, third-party service providers, and customers)
The “glue” that connects the different parts of the organization to control expenses, boost sales, and maximize profits
The art and science of integrating the flows of products, information, financials, and people through the entire supply pipeline - from the supplier’s supplier to the customer’s customer
Chain Structure
Suppliers → Manufacturers → Wholesalers/Distributors → Retailers/Customers
The 7 Rights (7 R’s) of Supply Chain
The right product
The right amount/quantity
The right condition
The right place
The right time
The right customer/person
The right cost/price
Four Two-Way Flows
The things moving back and forth through a supply chain
Product/Service
Information
Cash/Payment
People
Globalization Benefits (Micro)
Lower prices
Wider availability of goods/services
New employment opportunities
Globalization Challenges (Micro)
Increased complexity
Shorter product life cycles
New forms of competition
Why Supply Chain Management Matters Today - Key Challenges
Population growth - more of everything needs to be sourced, produced, and distributed
Urbanization
Land and resources
Technology and information
Globalization
Levels of Strategic Planning
Corporate Strategy
Strategic Business Unit (SBU)
Functional/Operational
Corporate Strategy (Strategic Planning Level)
Overall mission: Target businesses, acquisitions/diversitures, values, performance metrics, risk management
Long-term
What business should we be in?
Strategic Business Unit (SBU) - Tactical (Strategic Planning Level)
Semi-independent unit; identifies customer/market segments and competitive priorities; constrained by corporate strategy
Shorter-term
More detailed
How should our business unit compete?
Functional/Operational (Strategic Planning Level)
Demands, materials, and capacities at product level
Shortest-term
What do we specifically have to do to support corporate/SBU strategy?
SWOT Analysis
Strengths and weaknesses (internal)
Opportunities and threats (external)
Used at SBU level to build strategy
3 Key Factors of Developing a Supply Chain Strategy
Critical/Key Customer: Critical to the firm’s success and receives the firm’s focus
Value Proposition: The tangible and intangible benefits customers expect from the firm
Capabilities: What a firm does well; defines the types of problems a firm can proficiently address
Order Winners
Why customers choose a firm
Order Qualifiers
Minimum standards that must be met
Order Losers
Why customers avoid a firm
Value Proposition Characteristics (Well-Designed)
Features customers value and will pay for
Differentiates from competitors (hard to imitate)
Satisfies financial and strategic objectives
Reliably delivered via firm’s capabilities/supply chain
Consistent with firm’s social/core values
Product-Related Competitive Priorities
Quality
Fitness for consumption
Dimensions: Performance, features, conformance, reliability, durability, aesthetics, service/support, perceived quality
Timeliness
Reliability, speed, and availability
Lead time: Time from begin to end of activities
Time to market: Total time to conceive, design, test, produce, and deliver a product
Order-to-delivery: Time from order placement to receipt
Cost
Purchase, transaction, maintenance/repair, operating, salvage/disposal
Process-Related Competitive Priorities
Innovation: Radical/incremental change
Flexibility: Ability to respond to changes in products/processes/competitive environment
Sustainability: Operations that are profitable AND non-damaging to society/environment
Triple bottom line
ESG
Risk Management: Anticipating/dealing with unexpected events
Natural disasters, social factors, economic issues, tech issues, safety/security, cyber security (ransomware, IoT/big data risk)
Triple Bottom Line
Profit, people, planet
ESG (Environmental Social Governance)
Standards for socially conscious investors
Supply Chain Strategy Development
What is done over time, not what us written down as plans
Strategy = Execution + Feedback/Measurement
On-Shelf In-Stock %
% of time a product is available on the shelf
Total Supply Chain Cost
Sum of costs across all firms in a chain
Supply Chain Response Time
Time to recognize a demand shift, internalize it, replan, and adjust output
Cash-to-Cash Conversion Time
Time to convert a dollar spent on inventory into a dollar of sales revenue
Inventory Days of Supply
Calendar days of sales available based on recent activity
Dwell Time
Ratio of days inventory sits idle to days productively used/positioned
Strategic Profit Model (SPM)
Reveals how income statement and balance sheet data are interrealted
Shows how operational changes effect overall business performance
Converts operational changes into financial impacts
Main focal point: Return on assets (ROA)

Balanced Scorecard
Creates a cycle of planning → action → assessment → feedback
Prevents tunnel vision
All metrics center around the firm’s vision and strategy, keeping all functions aligned to common goals

Process
A system of structured activities that use resources to turn inputs into valuable outputs
Process thinking helps managers design, document, manage, and change business processes, and helps avoid the “functional silo” mentality to manage the entire cross-departmental process
Functional Silo Mentality
Departments operate in isolation, optimizing their own goals instead of collaborating across the organization - creating friction instead of smooth flow.
Juran’s Law
~15% of operational problems are due to human error; 85% are due to systematic process errors
Fix the process first, not the person
Pareto Principle
80/20 rule
80% off effects come from 20% of causes
Ex: 80% of sales come from 20% of products
Anatomy of a Process

Activities - 5 Categories (Anatomy of a Process)
Operations - change/transform inputs
Transportation - moves input place to place
Inspection - verifies results of an activity
Delay - unintentionally stops flow
Storage - formal inventorying of an input
Inputs, Outputs, and Flows (Anatomy of a Process)
Flows are informational or material
Process Structure (Anatomy of a Process)
How inputs, activities, and outputs are physically organized; structure limits process capabilities
Management Policies (Anatomy of a Process)
Decisions on revenue, quality, cost, eliminating non-value adding activities, and wait time
Capacity
The amount of output a process can produce given available inputs/resources
Maximum (Design) Capacity
Highest achievable level of output under ideal conditions for a limited time
Effective Capacity
Achievable level of output under normal conditions for an extended time
The main driver for capacity planning
Utilization
How much available capacity is actually used (actual vs. planned) as a %
Yield
Useable output from input (% non-defective)
Managing Capacity Strategies
Time flexibility from workforce
Seasonal workforce
Subcontracting/outsourcing
Dual facilities/shared resources
Flexible design configurations
Shift customer demand:
Vary pricing - off-peak discounts
Advertising/Promotion
Offer peripheral goods/services during slack periods
Economies of Scale
As output grows, fixed costs spread over more units → lower cost/unit
Volume discounts from suppliers and learning curve effect (the more you do something the better you get at it)
Diseconomies of scale: beyond some point, costs can increase per unit
Theory of Constraints
Every process has a constraint (bottleneck)
Variance consumes capacity
Processes must be managed as systems
Process measures are crucial to success
Every process must continually improve
Bottleneck
Any place demand is greater than or equal to capacity; limits the process’ ability to generate output; defines the maximum capacity of a system
Serial/Sequential Structure
Activities occur one after another → slowest step is the bottleneck
Parallel Structure
Capacity = Sum of the individual parallel resource’s capacities
Measures of Process Flow
Cycle time
Flow time
Little’s law
Cycle Time
Strictly the processing time of one unit
Flow Time
Cycle time + wait time
Total time for one unit to get through the entire process
Little’s Law
Flow time = Inventory level / throughput rate
Sources of Variability
Inputs: quality/delivery → blocking/starving, downtime
Processes: quality variance, resource availability, speed → rework/scrap
Outputs: product variety → changeovers; variable schedules/batching → moving bottlenecks
Processes Managed As Systems
Process elements are interdependent (activities, inputs, outputs, flows, structure, management, and policies) - changing one can unexpectedly affect others
Effective Metrics
Verifiable/Quantifiable
Aligned with standards/rewards
Support strategy
Enable monitoring, control, and improvement
Continuous Improvement - Kaizen
Incremental, team-based, short-term, action-oriented, repetitive improvement
small + small + small + … = LARGE
Critical Process Types To Focus Improvement On
Bottleneck (limits output; increases lead time; affects cost, quality, and flexibility)
Visibility (affects customers’ view of the firm)
Core Capability (hard to copy strategic skill; must be guarded/improved)
Feeder Process (feeds multiple downstream processes; a problem cascades)
Greatest Variance (variance amplifies through sequential steps)
Most Resources Consumed (biggest “bang for buck” when improved)
Product-Process Matrix
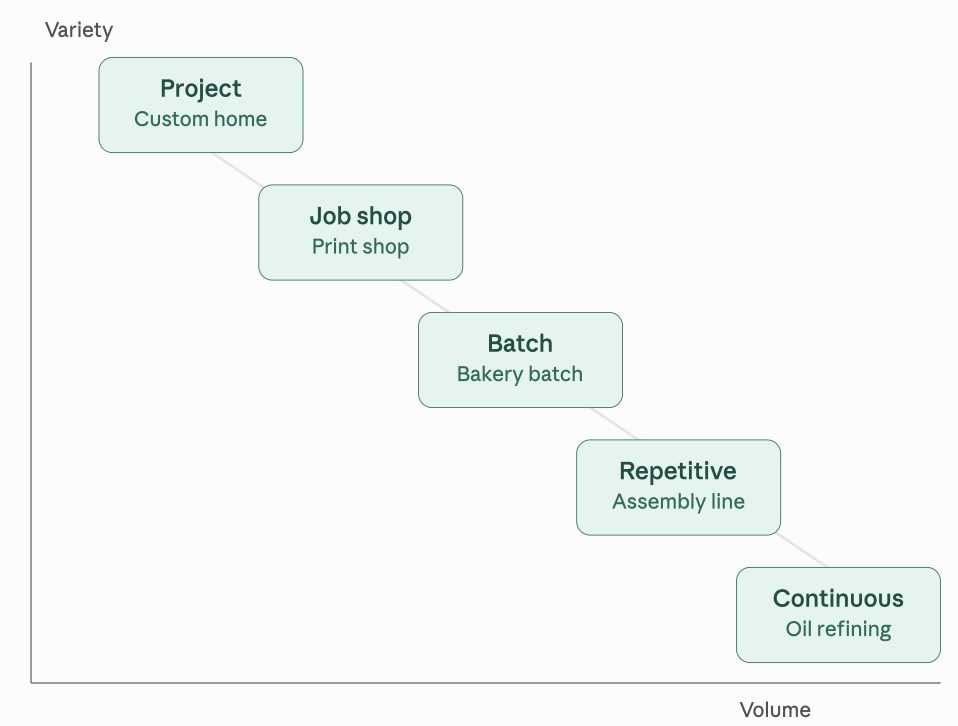
Project - Product-Process Type
Very low volume
Very high variety
Ex: Custom home, wedding planning
Unique
Activities sometimes outsourced to specialists
Job Shop - Product-Process Type
Low volume
High variety
Ex: Auto repair shop, beauty salon
High WIP inventory
Very skilled workers
Batch - Product-Process Type
Moderate volume
Moderate variety
Ex: Bakery, cinema
Set up time can be high
Moderately flexible workers and equipment
Economies of scale
Repetitive Process - Product-Process Type
High volume
Low variety
Ex: Appliances, buffet resturaunts
Standard methods and materials
Low skilled workers
Continuous Process - Product-Process Type
Very high colume
Very low variety
Ex: Gasoline, laundry detergent
Follow sequence
Operations often run 24/7
Line stoppages are very costly
Highly specialized equipment
Low skilled operators
Mass Customization - Product-Process Type
Products assembled from standard modules; configuration postponed until order is received
Cost advantages of high volume production while increasing variety
Cellular Manufacturing - Product-Process Type
Products with similar process characteristics made on small assembly lines (“cells”) to increase flexibility
Low volume and low variety
Engineer-to-Order (ETO)
Designed for individual customers
Long lead time
High customization
Make-to-Order (MTO)
Meets broad customer group needs
Some customization during production
Assemble-to-Order (ATO)
Standardized modules assembled differently
Configurable to individual needs
Make-to-Stock (MTS)
Finished goods held in inventory
Immediately available
Least customized
Service Blueprinting
Customer Actions
Everything customers do during service delivery
Front Office
Employee actions in face-to-face contact with customer
Back Office
Behind-the-scenes employee activity
Support Processes
Activities needed for service delivery, no direct customer contact
Physical Evidence
Tangibles the customer sees or collects
Operations Layouts
Fixed Position
Cellular/Functional
Product
Fixed Position Operations Layout
Product can’t move during production, inputs/resources come to it
Ex: House, bridge, surgery
Cellular/Functional Operations Layout
Workstations grouped by similar processing needs/functions
Ex: Gyms, large retailers
Product Operations Layout
Resources arranged along the regular sequence of activities
Ex: Automotive assembly lines, fast food kitchens
Line Balancing in Product Layouts
Determine presedence relationships
Calculate take time
= available production time per day / output needed per day
Determine minimum number of workstations
= total of all task times / takt time
Assign tasks to workstations using the longest operating time rule
Determine efficiency
= sum of all task times / (# of workstations X takt time) X100%
Maximum Capacity Utilization (Calculation)
(Actual output / max capacity) X 100%
Effective Capacity Utilization (Calculation)
(Actual output / effective capacity) X 100%
Yield (Calculation)
(Usable output / total output) X 100%
Precedence Diagram

Take Time (Calculation)
Available production time per day / output needed per day
Minimum # of Workstations (Calculation)
Total of all task times / take time → round up
Indifference Analysis (Calculation)
Total cost 1 = Total cost 2
Solve for volume X
Efficiency - Line Balance (Calculation)
(Sum of task times / ( # of workstations X take time)) X 100%
Push Markets
Push product to distribution channels
Make it available at point of purchases
Suppliers dependent on buyers
Pull Markets
Customer pulls product through supply chain
Buyers determine standard for suppliers
Activities 4 Categories
Value-adding: moves item closer to the form or location desired by customer
Necessary but no Value-adding: needed but doesn’t directly add value
Waste generating: consumes resources without adding value
Question mark: not easily categorized, keep asking why to get to root for reason for these activities
Kaizen Cycle

Market Orientation and Order Timing

Service Matrix?
