Unit 5 Stat
 Call Kai
 Learn
 Practice Test
 Spaced Repetition
 Match
 Flashcards
 Knowt Play
1/27

There's no tags or description
Looks like no tags are added yet.
28 Terms
Population Mean

Sample Mean

Weighted Mean

Combined Population Mean

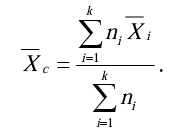
Combined Sample Mean
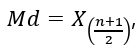
Odd Median
Even Median

Percentiles

Approximating Value for Percentiles for Small Data Sizes

Steps to Calculating Quartiles
Median
Q1
Q3
4 Measures of Absolute Dispersion
(1) Range
(2) Inter-Quartile Range
(3) Standard Deviation
(4) Variance
2 Measures of Relative Dispersion
(1) Coefficient of Variation
(2) Z-Score
Formula for Range
Range = Max — Min
Formula for IQR
IQR = Q3 — Q1
Formula for Population Standard Deviation

Formula for Sample Standard Deviation

Formula for Population Variance

Formula for Sample Variance

Population and Sample Coefficient of Variation

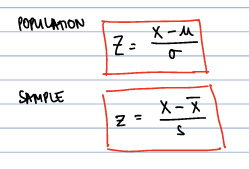
What is Z-Score?
The number of standard deviations away from the mean.
Population and Sample Formula for Z-Score
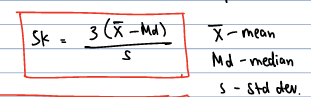
Pearson’s First Coefficient of Skewness

Pearson’s Second Coefficient of Skewness
Interpretations for Skewness

7 Number Summary
Max
Min
Median
Q1
Q3
FL
FU
What does a box plot look like?

Properties of the Mean
Add, Subtract, Multiply, Divide the Mean
Properties of Std Dev
Multiply, Divide Std Dev