Chapter 11 ecology: Population Growth and Regulation
 Call Kai
 Learn
 Practice Test
 Spaced Repetition
 Match
 Flashcards
 Knowt Play
1/65

There's no tags or description
Looks like no tags are added yet.
66 Terms
What four processes change population size?
Births and immigration add individuals; deaths and emigration remove them.
What does intrinsic growth rate (r) represent?
Maximum potential per capita population growth under ideal conditions.
What happens when r is negative?
Population declines; deaths exceed births in the simple closed-population model.
What does dN/dt = rN tell us?
Total growth depends on both per capita growth rate and population size.
Same r, but N doubles. What happens to dN/dt?
It doubles in the exponential model.
Why does exponential growth form a J-shaped curve?
More reproducing individuals cause larger absolute increases over time.
What distinguishes geometric from exponential growth?
Geometric uses discrete intervals; exponential models continuous growth.
What does λ > 1 mean?
Population increases between measured intervals.
What does λ = 1 mean?
Population size stays constant; births and deaths may still occur.
What does λ < 1 mean?
Population declines between measured intervals.
How are λ and r related?
λ = eʳ; therefore λ = 1 corresponds to r = 0.
How does a larger positive r affect doubling time?
Doubling time decreases; population doubles sooner.
What makes a factor density-independent?
Its effect does not depend on population density; e.g., a severe freeze.
What is negative density dependence?
Per capita growth decreases as density increases.
What is positive density dependence?
Per capita growth increases as density increases, often at low densities.
Why can very sparse populations reproduce poorly?
Mate or pollen limitation may produce an Allee effect.
Can one population experience both types of density dependence?
Yes. Low-density benefits can give way to high-density competition.
Why is competition for nesting sites density-dependent?
More individuals compete for limited sites, potentially lowering reproduction.
Are mutations automatically density-dependent factors?
No. Mutation occurrence does not automatically depend on crowding.
What is self-thinning in plants?
Competition causes some plants to die while surviving individuals grow larger.
What does carrying capacity K represent?
Population size the environment can sustainably support under given conditions.
Additional nesting habitat is created. What happens to K?
K can increase because more individuals can be supported.
Habitat is destroyed but N initially stays the same. What happens?
K can fall below N, causing negative growth in the logistic model.
What does (1 − N/K) represent in logistic growth?
A density-limitation term that approaches zero as N approaches K.
What happens when N is much smaller than K?
Density limitation is weak; logistic growth resembles exponential growth.
What happens when N = K?
Net population growth is zero in the standard logistic model.
What happens when N > K and r > 0?
The logistic model predicts population decline toward carrying capacity.
Where is total logistic growth fastest?
At N = K/2, the inflection point of the S-shaped curve.
Why isn't total growth fastest at very low N?
Resources are abundant, but relatively few individuals are reproducing.
Total vs. per capita logistic growth: how do their graphs differ?
Total growth is hump-shaped; per capita growth declines with N.
What does Figure 11.1's steepening J-curve indicate?
Absolute population growth accelerates under a constant positive r.

What does Figure 11.2's seasonal breeding pattern indicate?
Discrete breeding pulses make geometric growth a useful model.

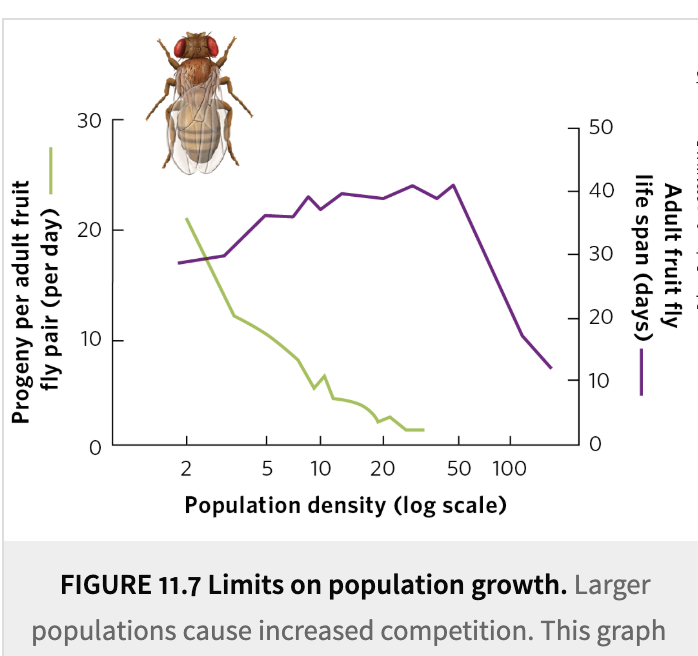
What does Figure 11.7's fruit fly experiment demonstrate?
More crowding reduces offspring production per pair through competition.
Why can one island stabilize while regional abundance rises?
The first island reaches local K while populations grow or colonize elsewhere.

What does Figure 11.11's cowslip example illustrate?
Small, sparse plant populations can have reduced reproduction from pollen limitation.
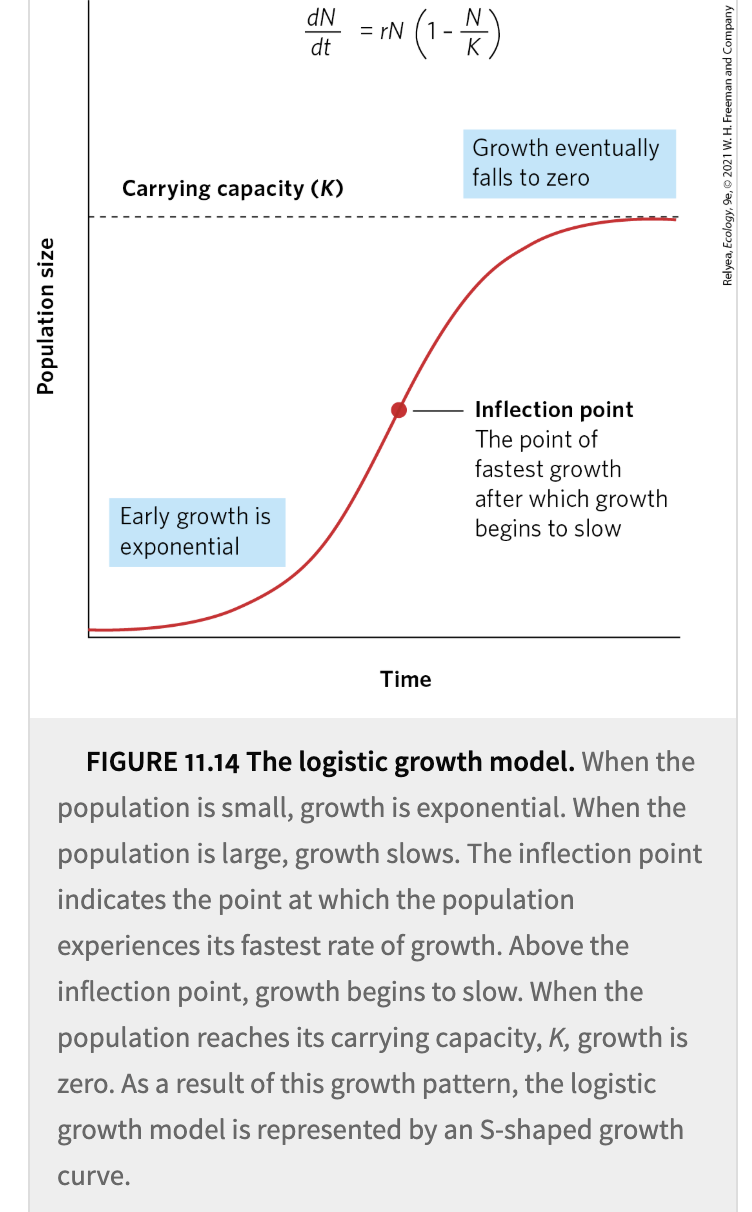
What is the key lesson of Figure 11.14?
Logistic growth accelerates, peaks in slope, then slows toward K.

What is the key lesson of Figure 11.15?
Overall growth peaks at K/2, while per capita growth falls with density.
What is age structure?
The proportions of individuals in different age classes.
Does stable age distribution mean constant population size?
No. Age proportions can remain stable while total population size changes.
What does a broad base on an age pyramid suggest?
Many young individuals, indicating potential future population growth.
What is a Type I survivorship curve?
High early and middle survival, with mortality concentrated later.
What is a Type II survivorship curve?
Approximately constant proportional mortality risk across ages.
What is a Type III survivorship curve?
High early mortality followed by lower mortality among survivors.
What does height on a survivorship graph represent?
The proportion of the original cohort still alive at that age.
What does a flatter log survivorship curve indicate?
Lower proportional mortality across that age interval.
What does the life-table column x represent?
Age class or life-history stage.
What does nₓ represent?
Number of individuals alive at age x.
How do you calculate survival rate sₓ?
sₓ = nₓ₊₁ / nₓ; survival from one age to the next.
How do you calculate survivorship lₓ?
lₓ = nₓ / n₀; fraction of the original cohort still alive.
Why is l₀ always 1?
All members of the starting cohort are alive at its initial age.
What does fecundity bₓ mean?
Average daughters produced per surviving female at age x.
What does lₓbₓ represent?
Survival-weighted reproductive contribution at age x.
How is net reproductive rate R₀ constructed?
Sum all age-specific lₓbₓ contributions.
What does R₀ > 1 indicate?
Females more than replace themselves under the life-table assumptions.
What does R₀ < 1 indicate?
Females do not fully replace themselves under the life-table assumptions.
Juvenile survival falls; bₓ stays constant. What happens to R₀?
R₀ decreases because fewer individuals reach reproductive ages.
Why can high fecundity fail to produce high reproductive contribution?
Few individuals may survive long enough to reproduce.
What does x lₓ bₓ contribute to estimating?
Generation time, by weighting reproductive contribution by age.
How can earlier reproduction affect population growth?
Shorter generation time can increase growth per unit time at the same R₀.
What defines a cohort life table?
Follows individuals born together through their lives.
What defines a static life table?
Estimates age-specific survival and reproduction from a single-time snapshot.
How does age-structured census projection differ from a cohort table?
Projects all age classes forward, rather than tracking one birth cohort.
Where do survivors appear in next year's census?
In the next older age class.
Where do newly produced offspring appear in next year's census?
In age class 0.
What is the first step in projecting survivors to the next census?
Multiply current age-class abundance by its interval survival rate.
Why might adult survival be important for sea turtle conservation?
Surviving adults can reproduce repeatedly; losing them removes future reproduction.