Statistics Q1
 Call Kai
 Learn
Learn Practice Test
 Spaced Repetition
 Match
Match Flashcards
 Knowt Play
1/30

There's no tags or description
Looks like no tags are added yet.
Name | Mastery | Learn | Test | Matching | Spaced | Call with Kai | Chat |
|---|
No analytics yet
Send a link to your students to track their progress
31 Terms
Population
the entire group of individuals, items, objects, or events that a researcher wants to study and draw conclusions about
Sample
a smaller, manageable group taken from a larger total group (called a population) to study and draw conclusions
Parameter
a fixed numerical value that describes a specific characteristic of an entire population
Example: The mean # of activities (mean number of glasses of milk drank per day by the 5 students)
Statistic
Corresponding mean for the sample
Example: “Corresponding mean for number of kids in English class".
Variable
any characteristic, number, or quantity that can be measured or counted, and whose value changes (varies) from person to person, place to place, or thing to thing
Example: “Amount of milk glass drank per day”
Data
a collection of numbers, facts, and measurements gathered to answer questions, spot patterns, or understand a group
Example: 1, 0, 1, 3, 4
Mean
Equal share balance point
Median
Ordered middle
Mode
Most frequently shown value
Example: 3, 4, 5, 5, 6, 14
Mode: 5
Categorical Data
information that sorts items into distinct groups or categories using names, labels, or descriptions instead of numbers (typically non-numerical values)
Examples: Names, Eye color, Gender
Quantitative
Measure or count an amount (numerical values)
Examples: Ages, Height, Weight
Statistical Claim
A conclusion or a statement presented as being supported by data
Sampling frame
The list or accessible group from which the sample can be selected
Claim reach
The people, objects, place, or time period the conclusion says it describes.
Relative Frequency
the frequency divided by the total number of observations (f/n).

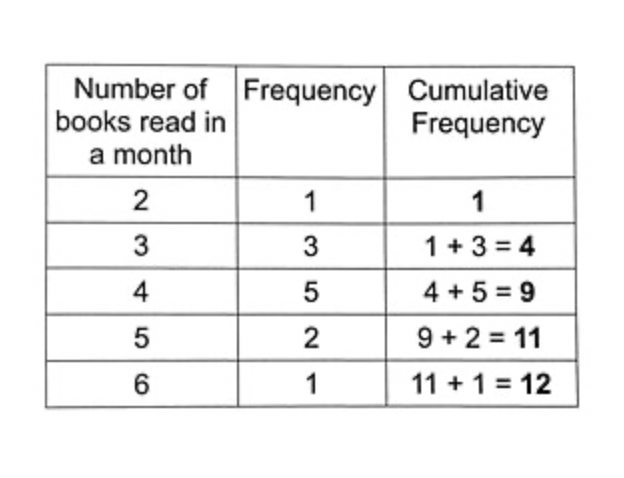
Cumulative Frequency
the running total of frequencies added up row by row in a data set
Discrete Quantitative Data
Separate numerical counts
Examples: Number of shoes owned, Number of classes taken each school year, IQ Scores
Continuous Data
Numerical measurements: Weight, Height, Size
Boundary Language
Words such as less than, fewer than, from, and between that determine which values are included.
Data Sampling
Selecting and studying part of a population to learn about the whole population
Representative Sample
A sample that reflect relevant characteristics of the population closely enough to support the intended conclusion.
Random Sampling
A chance process gives population members a known opportunity to be selected
Simple random sample
Every possible sample of the same six has an equal chance of selection
Systematic Sample
Chose a random starting point, then select every kth member of an ordered frame
Convience Sample
Select people who are readily available: this is non-random
Population inference
Using a sample statistic to draw a conclusion about a population
Selection Bias
A systematic process that favors or excludes groups based on certain prejudices.
Question: Who has a greater chance to volunteer or be reached?
Stratified Sample
research method where you divide a total population into smaller, non-overlapping groups based on shared traits, then randomly pick samples from each group
Undercoverage
Groups in the population are absent from the sampling frame
Question: Who never had a path into selection?
Non responsive bias
People selected for the sample do not provide data
How might respondents differ from selected non-respondents?
Response Bias
Wording or influence changes the answers recorded
Question: What could push a person toward one response?