STA 100 Midterm 1
 Call Kai
 Learn
Learn Practice Test
 Spaced Repetition
 Match
Match Flashcards
 Knowt Play
1/51

There's no tags or description
Looks like no tags are added yet.
Name | Mastery | Learn | Test | Matching | Spaced | Call with Kai | Chat |
|---|
No analytics yet
Send a link to your students to track their progress
52 Terms
statistic
numerical measure calculated from sample data; a function of our data
parameter
numerical measure calculated from the entire population
n
of a summation, indicates the end of the index
i=1
of a summation, index/iterator representing the start of a data set
xi
variable/name of list column in excel
percentile
the pth percentile is the value of y where p% of the data values are less than y and (100-p)% of data values are greater, sometimes denoted Pp
sort the data numerically
first step of the general algorithm for any arbitrary percentile
c
of a summation, a constant that can be factored out from the variable
y bar
sum of all values over sample size, represents sample mean
i.e. 1/n times sum of yi
calculate the index position number
second step of the general algorithm for any arbitrary percentile
use rounding rule
third step of the general algorithm for any arbitrary percentile
Ip = (p/100)(n+1)
index position number formula
y tilde
median, 50th percentile value of y
i.e. middle of sorted data
five number summary
statistics used to compose a boxplot: min, Q1, Q2 (median/y tilde), Q3, max
mode
the most frequently occurring value(s) of y in dataset
Q1
median of the lower half of the ordered data (not including the median)
Q3
median of the upper half of the ordered (not including the median)
range
{max yi - min yi}
interquartile range (IQR)
the range of the middle 50% if the data
Q3 - Q1 or P75 - P25
sample variance (s2)
average squared deviation/distance from the mean
NOT used to interpret variance because the units are squared
(1/n-1) Σ (yi - y bar)2 = (1/n-1)[(Σ yi2) - n(y bar)2]
sample standard deviation (s)
average or typical deviation from the mean, used to interpret standard deviation
frequency
the amount of times an observation occurs
relative frequency
frequency over the sample size
i.e. proprtion, propbability
percent frequency
relative frequency*100%
i.e. (frequency/sample size)*100%
random variable
a variable whose outcome is the result of some random process and do not know the value/outcome in advance
numeric
RV naturally measured as numbers
continuous and discrete
continuous
numerical RV, take on ANY value in an interval (at least theoretically)
ex. weight, volume, time, temperature, blood pressure, % grade
discrete
numerical RV, numbers with natural gaps between values (often integers)
ex. # counts, people, engines, outcomes of a die roll
categorical
RV naturally measured as labels, groups, factors, levels
nominal and ordinal
nominal
categorical RV, no natural ordering or ranking
ex. eye color, cancer site, car brand, sex, race
ordinal
categorical RV, does have natural ordering or ranking
ex. cancer stage, letter grades, low/med/high, taxonomy
Y
denotes the set all possible values of a RV
Yi
denotes the ith value of RV Y an itself still random before measuring
y
denotes one specific value of a RV
bar chart
separated bars with an interchangeable scale of frequency, rel. frequency, or percent
represents categorical data
stacked bar chart
grouped frequency bar chart and variables are stacked
stacked relative frequency
grouped percentage bar chart and variables are stacked to sum to 100%
side by side bar chart
grouped bar chart, typically contains nominal AND ordinal data
histogram
values grouped into bins or intervals of equal width with no gaps
can show bins as freq., rel. freq., or percent
represents numerical data
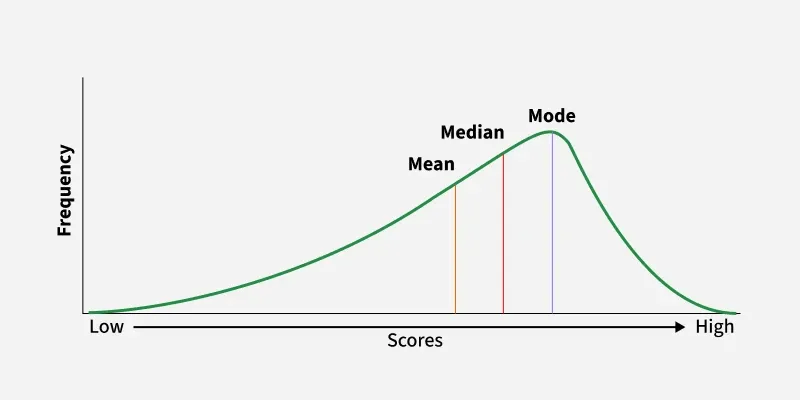
left skewed
left tail of data is longer
mean < media < mode
ex. % grades
right skewed
right tail of data is longer
mode < median < mean
ex. income, wealth, lifespan of humans

sample space
the set of ALL possible outcomes of an experiment, represented by S
event
any subset of the sample space
probability
a number between 0 and 1 (inclusive) representing how likely an event is to occur
P(A)
theoretical probability
assumes we know all possible events, outcome, probabilities
(# times event A occurs)/(# all possible events)
P hat (A)
empirical probability
an estimate of the true probability based on a sample of observed data
(# times event A occured in sample)/(sample size n)
as n approaches infinity, approaches theo. probability
0 ≤ P(A) ≤ 1
probability rule that states if P(A) = 0, the outcome never happens and if P(A) = 1, the outcome always happens
therefore, P(A) cannot be negative or greater than 1
sum of all probabilities
∑n, i=1 P(Ai) = 1, probability rule that states if we have n possible outcomes of an experiment, then the _________________ is 1
1 - P(A)
probability rule that states the event that A does not occur is Ac (read as A complement)
P(Ac) = _______