STAT2550-Unit1
 Call Kai
 Learn
Learn Practice Test
 Spaced Repetition
 Match
Match Flashcards
 Knowt Play
1/26

There's no tags or description
Looks like no tags are added yet.
Name | Mastery | Learn | Test | Matching | Spaced | Call with Kai | Chat |
|---|
No analytics yet
Send a link to your students to track their progress
27 Terms
statistics
this involves collecting, classifying, summarizing, organizing, presenting and interpreting numerical information
experimental (or observational) unit
is an object (e.g. person, animal, thing, transaction, or event) about which we collect data
-Examples:
Each patient in a clinical drug trial
A smartphone used in a battery life test
Each car tested for fuel efficiency
A customer providing feedback in a survey
A tree observed for growth rates in an environmental study
population
is a set of units (usually people, objects, transactions, or events) that we are interested in studying
-Examples:
All employees in a company (In the study is about job satisfaction, workplace safety, or productivity of employees in that particular company)
All households in a city (In the study concerns income levels, energy usage, or housing conditions of the household in that particular city)
variable
is a characteristic or property of an individual experimental (or observational) unit in the population
-Examples:
Age of students (years)
Income of employees (dollars)
Gender of survey respondents
Type of car owned (SUV, sedan, truck)
Eye colour (blue, green, brown)
sample
is a subset of the units of a population
representative sample
exhibits characteristics typical of those by the target population
statistic
is a number that represents a property by the target population
-Examples:
Average age of students in a sample
Average income of employees in a sample
Proportion of male survey respondents in a sample
Proportion of people with SUV in a sample
Proportion of people with blue eyes in a sample
parameter
is a number that represents a property of the whole population that can be by a statistic
-Examples:
Average age of students in a population
Average income of employees in a population
Proportion of male survey respondents in a population
Proportion of people with SUV in a population
Proportion of people with blue eyes in a population
statistical inference
is an estimation, prediction, or some other generalization about a population based on information contained in a sample
measure of reliability
is a statement (usually quantitative) about the degree of uncertainty associated with a statistical inference
descriptive statistics
utilizes and graphical methods to look for patterns in a data set, to summarize the information revealed in a data set, and to present that information in a convenient form
-Examples:
Average age of employees in a company
A chart displaying proportions of product preferences
Table summarizing sales figures by region
Inferential statistics
utilizes sample data to make estimation, designs, predictions, or other generalizations about a larger set of data
-Examples:
Predicting future sales based on past trends
Estimating the average weight of fish in a lake using a sample
Forecasting election results based on exit polls
Testing whether a new fertilizer increases crop yield
Estimating customer satisfaction levels using a survey
Quantitative (or numerical) data
are measurements that are recorded on a naturally occurring numerical scale
Discrete data
often takes the values as whole numbers
-Examples:
Number of students in a classroom (e.g. 25, 30, 32)
Number of cars owned by a family (e.g. 0,1,2,3)
Number of goals scored in a soccer match (e.g. 0,1,2,4)
Continuous data
can take any value within a range
-Examples:
Height of students in a class (e.g. 150.2cm, 165.8cm, 172.5cm)
Temperature of a city over a week (e.g. 23.5oC, 25.0oC, 19.3oC)
Weight of a newborn baby (e.g. 3.2kg, 3.8kg, 4.1kg)
Qualitative (or categorial) data
are measurements that cannot be measured on a natural numerical scale; they can only be classified into one of a group of categories
nominal data
represents categories that have no inherent order or ranking
-Examples:
Types of pets owned (e.g. dog, cat, bird, fish)
Favourite ice cream flavours (e.g. vanilla, chocolate, strawberry)
Eye colour of individuals (e.g. brown, blue, green)
ordinal data
represents categories with a meaningful order or ranking
-Examples:
Education level (e.g. high school, Bachelor’s, Master’s, Ph’D)
Fitness class levels (e.g. beginner, intermediate, advanced)
class rankings (e.g. freshman, sophomore, junior, senior)
designed experiment
Is a data collection method where the researcher exerts full control over the characteristics of the experimental units sampled. These experiments typically involve a group of experimental units that are assigned the treatment and an untreated (or control) group
-Examples:
Testing the effect of a new drug with control and treatment groups
Analyzing plant growth with different fertilizers
Comparing student performance using different teaching methods
Measuring the effect of exercise on weight loss
Testing the effeciency of a new machine in a factory
observational study
Is a data collection method where the individual units sampled are observed in their natural setting. No attempt is made to control the characteristics of the individual units sampled
-Examples:
Analyzing traffic patterns by observational intersections
Studying smoking habits and lung cancer risk
Observing social media usage without intervention
Analyzing rainfall and crop yields without altering conditions
Surveying dietary habits without influencing behaviour
Simple random sampling
each unit is chosen randomly, and everyone has an equal chance of being selected
-Examples:
Selecting students for a survey using a random number generator
Assigning numbers to survey participants and using a random table to select samples

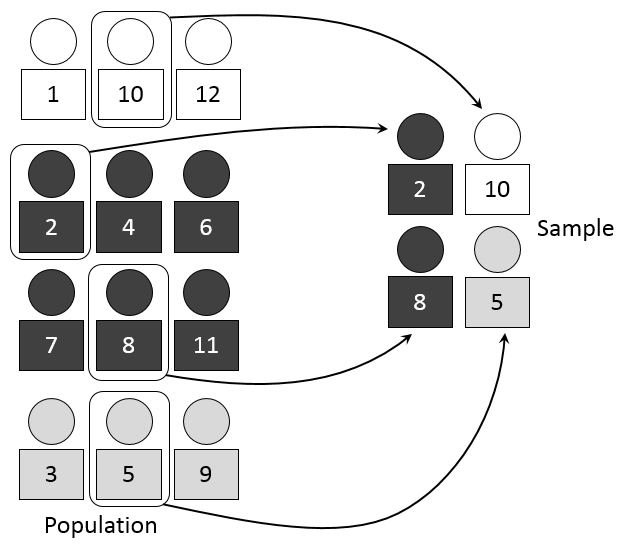
stratified sampling
The whole population is divided into homogeneous strata or subgroups according to a specific factor. Then, the researchers draw a random sample from the different strata
-Examples:
Sampling employees based on job roles-managers, technicians, and sales staff
Studying income distribution by dividing participants into income brackets
cluster smapling
The target population is divided into groups (known as clusters), and a simple random sample random sample of the groups is selected. The elements in each cluster are then sampled
-Examples:
Dividing a city into blocks and randomly selecting blocks to survey every household within those blocks
Randomly sampling hospitals in a region and examining all patient records within those hospitals

Selection bias
results when a subset of the units in the population is excluded so that these units have no chance of being selected I the sample
-Examples:
Studying political opinions by polling attendees at a rally for one party
Analyzing consumer preferences by surveying shoppers at high-end mall, ignoring lower-income groups
Evaluating healthcare access by surveying patients at private clinics and excluding public hospital patients
nonresponse bias
results when a researcher is unable to obtain data on all units selected for the sample
-Examples:
Sending email surveys, but only tech-savvy people respond, excluding those without internet access
Conducting phone interviews during work hours, excluding people who are employed full time
Mailing surveys about income, and wealthier participants decline to respond due to privacy concerns
measurement error
refers to inaccuracies in the values of the data recorded. In surveys, this kind of error may be due to ambiguous or leading questions and the interviewers effect on the respondent
-Examples:
Using a scale calibrated incorrectly, resulting in weight measurement errors
A poorly worded questionnaire asking respondents to rate satisfaction on a 1-5 scale without clarifying what 1 or 5 means
Asking “How many hours do you exercise per week?” without defining what counts a exercise
unethical statistics
researchers who are aware of these problems yet continues to use the sample data to make inferences are practising