Aggregate Demand and Supply
 Call Kai
 Learn
Learn Practice Test
 Spaced Repetition
 Match
Match Flashcards
 Knowt Play
1/20

There's no tags or description
Looks like no tags are added yet.
Name | Mastery | Learn | Test | Matching | Spaced | Call with Kai | Chat |
|---|
No analytics yet
Send a link to your students to track their progress
21 Terms
what is the formula for Agreggate Demand
AD = C + I + G + (X-M)
consumption + firms + govt spending + (exports - imports)
what does the “C” stand for in the AD formula
Consumption
spending by consumers on goods and services.
Main influence: level of disposable income - minus direct taxes +state benefits.
When incomes rise total spending rises
what does the “I” stand for in the AD formula
Investment
spending by firms in plant and equipment, buildings, machinery, etc
Rise in Consumer demand: they will invest more to make more profit
fall interest rates: loans become cheaper , people pay less for their houses = more disposable income
what does the G stand for in the AD Formula
Govt Spending: spending on public goods and services
what is the components in the AD formula influenced by
Tax revenue: depends on how effeiciently it can collect the tax from people, firms, etc
Present economic conditions: If there is inflation then govt will spend less, in a recession govt will spend more
what does (X-M) stand for in the AD formula
exports - imports
the main influences on exports are lower currency and an increase in GDp, local demand is met and so people sell goods overseas
Rise in incomes abroad = more demand for exports
what is the Graph for AD and GDP and explain it
the AD curve shows the relationship between price rises in the country and Real GDP
A rise in the Price Level from P1 to P2 will lead to a fall in real GDP from R1 to R2. When Prices rise demand for goods fall, supply falls and GDP falls
When Prices fall from P2 to P1 then Real GDP rises
when prices fall more goods are demanded adn more is supplied so real GDP rises

why does AD fall when the price level rises and vice versa
the wealth effect: Rise in price levels lead to lower consumer demand. Rising Price means your wealth can now buy less
The international effect: A rise in the price of out goods locally mean our export products become more expensive for overseas buyers. Price Rises, AD falls bc exports fall
The interest rate effect: When prices rises the reserve bank will raise interest rates to try reduce inflation. Higher interest rate means people pay more for their mortages. Consumption falls, firms invest less because interest rate is too expensive
what will a change in price cause to the Demand curve
a movement along the curve, but a non price factor will change the whole curve to shift left or right
what will cause the AD curve to shift right for consumption
Consumption: Rise in consumer confidence, cut in income tax, and increase in income tax, and increase in wealth, increase in population, RBNZ increases money supply
what will cause the AD curve to shift right for investment
rise in business confidence, cut in company tax, advances. in technology
what will cause the AD curve to shift right for govt spending
desire to stimulate demand or increase political support
what will cause the AD curve to shift right for net exports
a fall in the exchange rate leads to an increase in demand for our exports, a rise in the quality of our goods, increase in income abroad
what is aggregate supply
total supply of goods that all firms in the economy are willing and able to produce
how long is aggregate supply in the short run, and long run
short run: under 12 months
long run: any period over 12 months
what happens with aggregate supply in the short run
in the short run, firms are not able to change factors of production readily
we cant change the amount of machines because its expensive
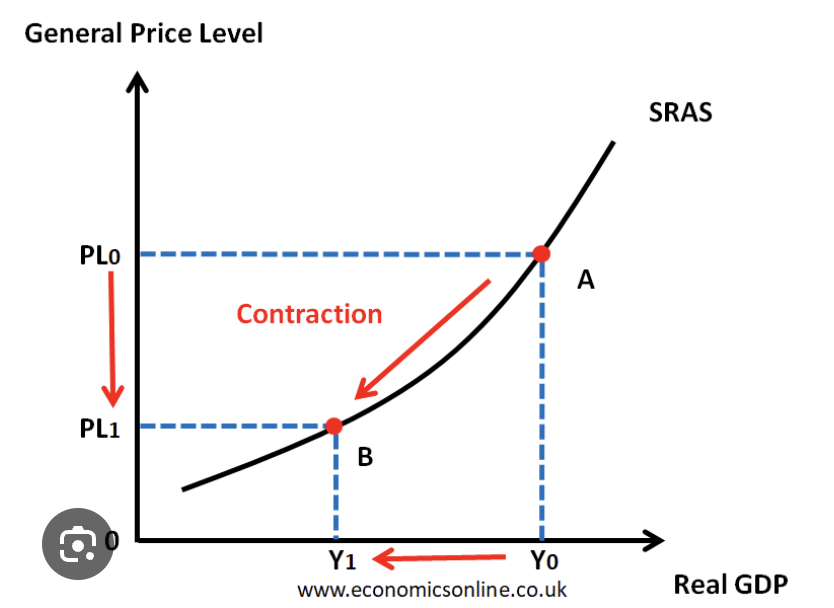
what is the SRAS real gdp graph
SRAS is the output that will be supplied at different price levels in a period of time when prices of FOP remain unchanged
as Price rises firms supply more, because cost of production is the same but prices are rising meaning profit
if prices rise there will be a movement along the SRAS curve
what are 3 reasons why firms supply more at rising prices
1) profit effect - price of FOP remains the same but price rises
2) cost effect: avg costs in the short run may start to rise as firms have to pay overtime to workers, firms then raise price
3) mis-interpretation effect: firms may think that rise in price means an increase in popularity of their good,they produce more
what are some factors that shift the SRAS curve to the left or right
1) if the cost of wages rises but there is no rise in labour productivity the SRAS will shift left
2)change in company tax: a fall in company tax will shift SRAS to the right and vice versa
3)rise in labour productivity or discovery of new capital equipment will cause SRAS to shift right
4) a change in qty of resources: in the short run, the firm can obtain more resources and SRAS will shift to right
what is long run aggregate supply
the total output of the country in a period of tie when the quantity and prices of factors of production can change
in the long run all factors of production can be changed
what is the graph for long run aggregate supply
when output rises from 0 to Y at a time when output and employment is low, then there is no pressure on prices
as output rises from Y to Y1 firms begin to experience shortages of resources (labour) and the price of wages increases. The cost of land and equipment rises and hence price rises.
when output hits Y1 the economy reaches max output that it can achieve with fixed resources
beyond this point Y increases output and will lead to increases in prices
