Marketing Exam 2
 Call Kai
 Learn
 Practice Test
 Spaced Repetition
 Match
 Flashcards
 Knowt Play
1/129

There's no tags or description
Looks like no tags are added yet.
130 Terms
Marketing research (definition)
The process of defining a marketing problem or opportunity (the 'research question'), systematically collecting and analyzing information, and recommending actions.
Why is marketing research important? (its use)
Marketers conduct marketing research to reduce the risk of their marketing decisions and thus improve them.
Garbage in, garbage out: a wrong objective, wrong questions, or a badly designed study gives useless results.
New Coke lesson #1: the wrong research question
The real issue was WHY Coke's market share was declining.
Coke oversimplified it into 'how do we win taste tests?' because of the Pepsi Challenge.
Lesson: don't let your competitor dictate your research problem.

New Coke lesson #2: asking questions the wrong way
Tested New Coke as an ADDITION to the product line, not as a REPLACEMENT for the original.
The testing environment didn't match real life: people preferred the sweeter formula in small sips, but over a whole bottle, they preferred original Coke because it is less sweet. Quantity matters.

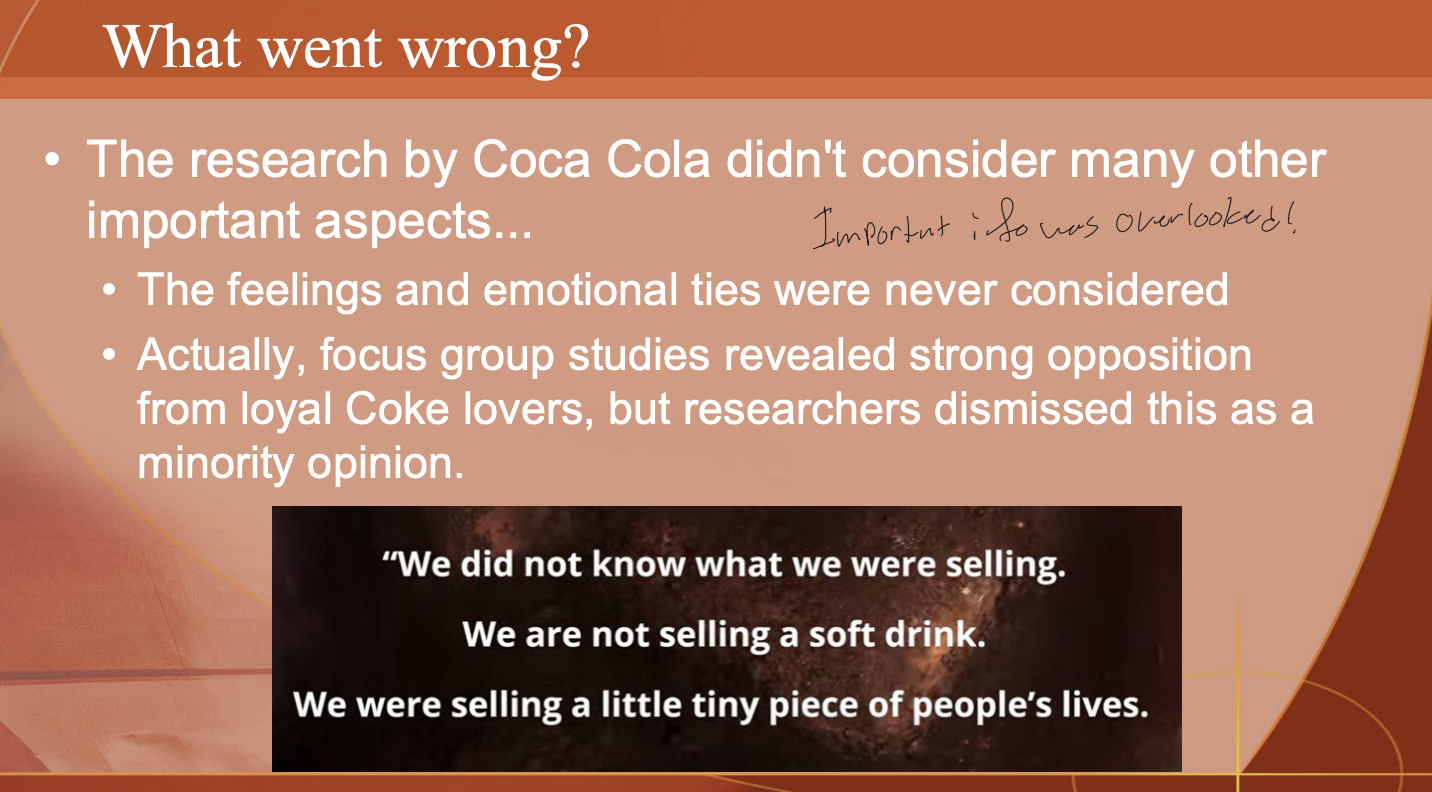
New Coke lesson #3: overlooked information
Feelings and emotional ties to the brand were never considered. Focus groups showed strong opposition from loyal Coke lovers, but researchers dismissed it as a minority opinion. (New Coke is an example of LOW VALIDITY.)
Marketing research process: the 5 steps
Define the problem. 2. Develop the research plan. 3. Collect relevant information. 4. Develop findings. 5. Take marketing actions.

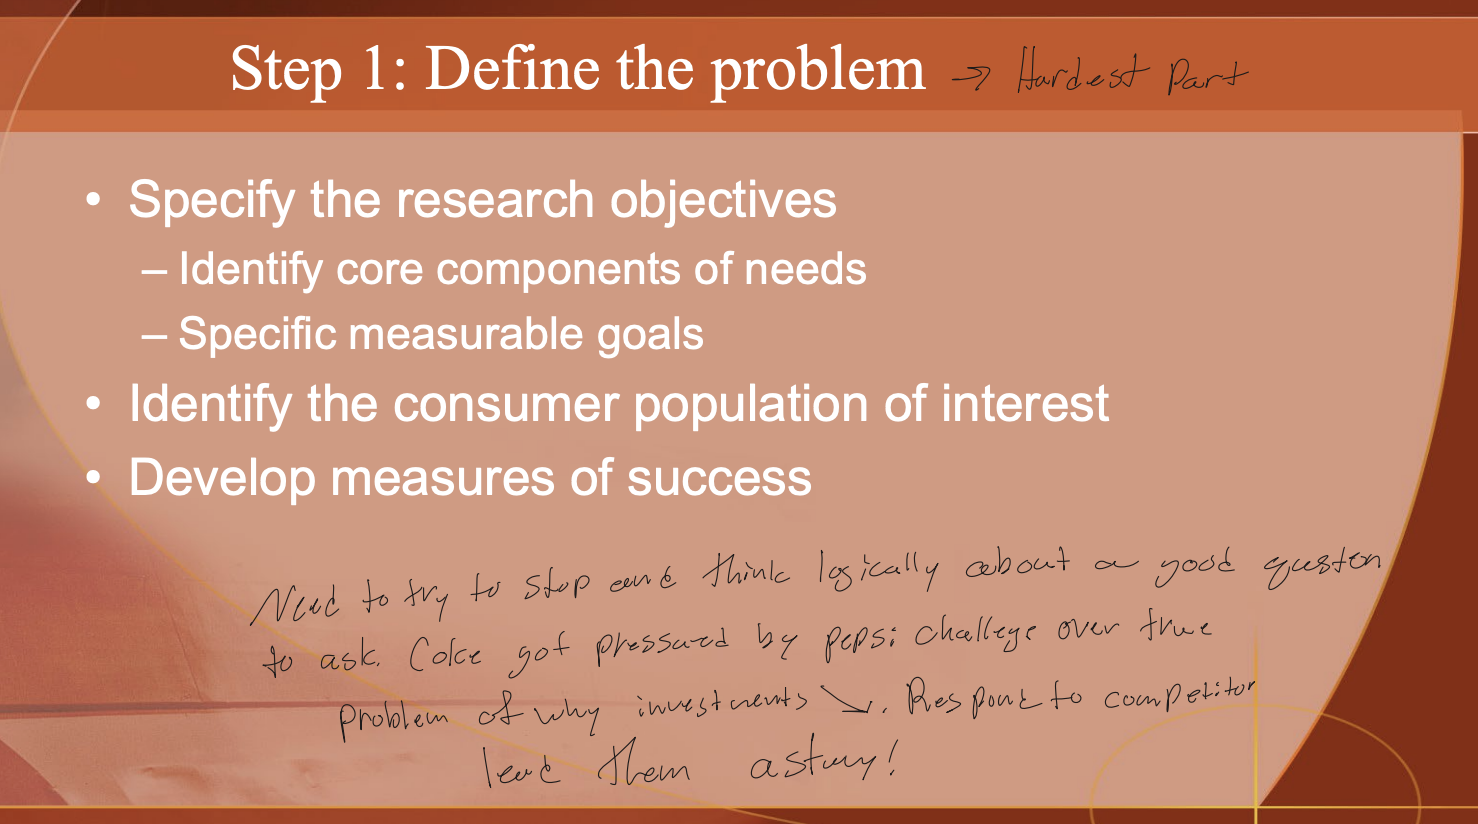
Research process Step 1: Define the problem
The hardest and most important step.
Specify the research objectives
Identify the core components of needs
Set specific, measurable goals
Identify the consumer population of interest
Develop measures of success.
'If I had an hour, I'd spend 55 minutes finding the proper question.'
Coke rushed this step under pressure from the Pepsi Challenge.
Research process Step 2: Develop the research plan
Specify constraints (time and money; be realistic).
Decide what type of data is needed
Primary vs. secondary, qualitative vs. quantitative, internal vs. external, experimental (cause and effect).
Decide how the data will be collected.

Research process Step 3: Collect relevant information
Gather secondary data (already exists) and/or primary data (newly collected). Firms often use both: secondary data shows quickly what's already out there, and primary data fills in what's missing.
Secondary data vs Primary data
Secondary
Facts and figures that were already recorded BEFORE the project at hand, or for a DIFFERENT purpose than the project at hand.
Primary
Facts and figures that are NEWLY collected for the problem at hand.
Ask what the data was collected FOR.
Collected for THIS research problem = primary.
Collected for another purpose, or earlier = secondary.

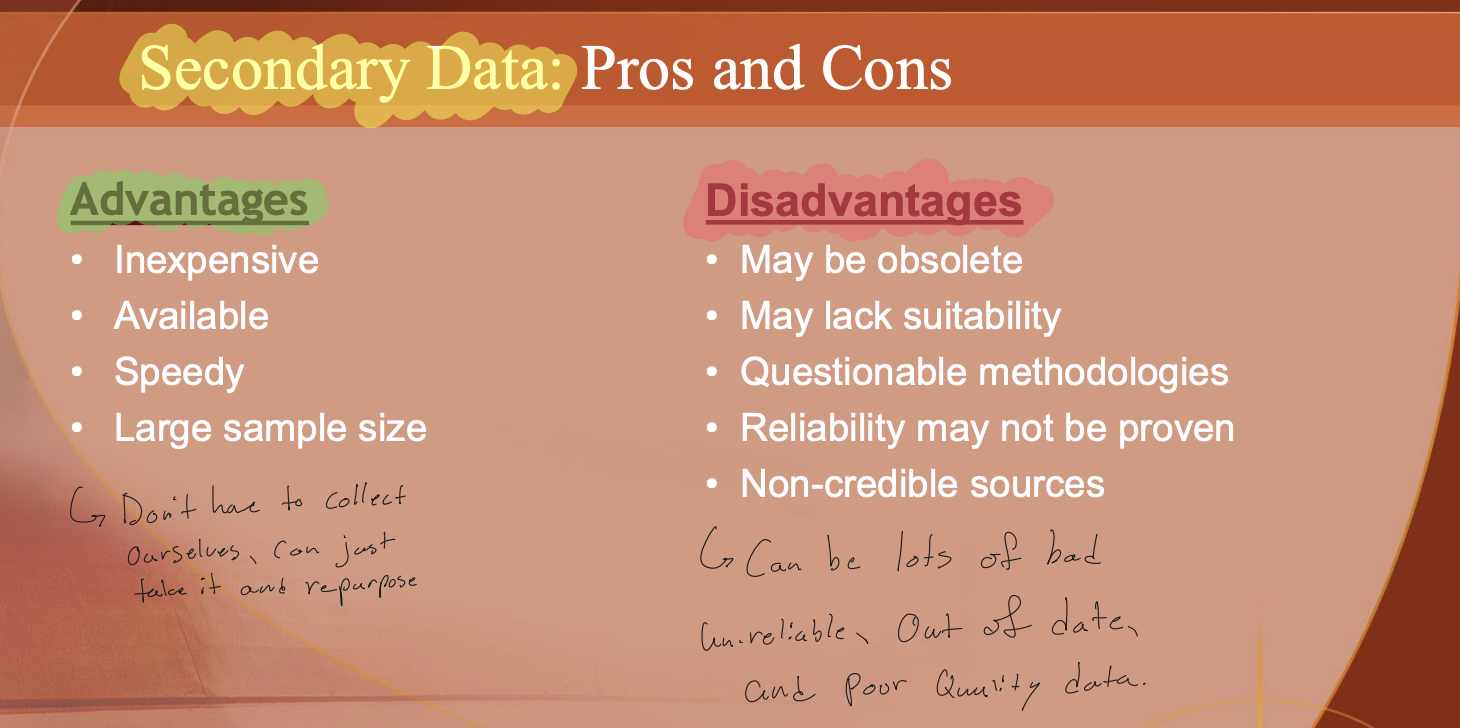
Secondary data: Pros and Cons
Pros
Inexpensive, available, speedy, large sample size.
You don't have to collect it yourself; you can take it and repurpose it.
Cons
May be obsolete; may lack suitability; questionable methodologies; reliability may not be proven; non-credible sources.
There's a lot of out-of-date or poor-quality data.
Primary data: Pros and Cons
Pros
Precise, current (right now and directly relevant to your project), known methodology, unique, reliable.
Cons
High costs, time-consuming (you have to design the study yourself and need a strong skill set to collect it well), limited generalizability.

How to collect secondary data? Internal/External + syndacted
Internal
Secondary data from INSIDE the firm
Sales transaction records (customer identity, discount responsiveness, etc.) and normal interactions with customers (emails, call reports/logs).
External
Secondary data from OUTSIDE the firm
US Census data, internet-based reports, and syndicated data (scanner data, panel data).
Syndicated
External secondary data collected by a third party and sold for profit to many companies, kept as general as possible.
Examples: Nielsen (TV ratings), IRI (retail scanner data). Includes scanner data and panel data (e.g., households paid to record their purchases).

Qualitative data
Comes from EXPLORATORY research (interviews, focus groups, ethnography, projective techniques, observation).
Small samples
Digs into the WHY
People's reasoning, emotions, and deep-rooted feelings.
Findings are subjective and open to the researcher's interpretation.
Quantitative data
Comes from DESCRIPTIVE research (surveys, panels, conjoint analysis).
Large samples
Numbers you can run statistical analysis on.
3 types of primary research (methodologies overview)
Exploratory (qualitative)
Interviews, focus groups, ethnographies, projective techniques, observation.
Descriptive (quantitative)
Surveys, panels; cross-sectional or longitudinal.
Experimental (cause/effect)
Lab experiments, field experiments.

Exploratory research: definition and elements
A technique marketers use to generate insights for future, more rigorous studies.
Provides QUALITATIVE data.
Forms
Individual interviews, focus groups, ethnography, mystery shoppers, projective techniques (and observation).

Exploratory example: individual interviews
One-on-one, in-depth interviews: one customer at a time, capturing detailed nuances.

Exploratory example: focus groups
Group discussions, usually about 6-10 people, sharing opinions, emotions, and deep-rooted feelings about an ad, company, or product
A more efficient way to have in-depth conversations with a larger group.
Drawback: Can we trust participants?
People may be scared to speak up or disagree, so there's a risk of bias from group influence, and they may not share personal preferences in front of a group (e.g., Hinge).

Exploratory example: ethnography
Direct observation in a NATURAL setting to see how people actually behave.
Such as in their homes, workplaces, or grocery stores, to understand how they actually behave.
Why Ethnography
What people say they do isn't always what they actually do.
For example, imagine a company wants to understand how consumers shop for groceries...
Example
Underhill's retail research uses human trackers (unobtrusively follow shoppers), video analysis (store traffic flow and interactions), and contextual interviews (compare stated intentions with observed behavior).
Everything in a grocery store is planned.
Attack your senses, especially smell, with flowers and baked goods at their entrance. Even how you walk down the asile, left hand pushes while right grabs

Exploratory example: mystery shoppers
Companies hire researchers to pretend to be a customer and visit their stores to obtain the point of view of an actual customer
Individuals hired to evaluate customer experiences by posing as regular customers.
For example, Starbucks may hire a mystery shopper to visit a store in their chain....
How friendly are the employees? How long the service takes? Whether the store is clean?
The mystery shopper then reports their observations back to the company
Class example: a mystery shopper with a hidden camera caught employees at a vape store pocketing cash sales.

Exploratory example: projective techniques
Various techniques to assess things people are unable to express, often because these things are part of the person's subconscious/unconscious process
Help researchers understand what consumers truly feel about a product, service, place, or experience
Instead of asking consumers direct questions, researchers use indirect or creative questions to uncover their underlying thoughts and feelings.
Word Association: "When you hear Walmart, what's the first word you think of?"
Sentence Completion: "People who buy luxury brands are
Their answers may reveal underlying attitudes or stereotypes.
Third-Person Techniques: Instead of asking consumers about themselves, we ask them to describe someone else.
For example, we show a grocery shopping list and ask what kind of person would buy those products.
Collage and Metaphor Techniques:
"Choose 3-5 images that best represent how Instagram makes you feel. Arrange them into a collage and explain why you chose them."
Roach killer example
Women drew roaches as men who had abandoned them, so they preferred sprays that let them watch roaches die.
Findings are subjective, which is why these are exploratory.

Descriptive research: definition and elements
Provides QUANTITATIVE data.
Investigates the marketing problem systematically using LARGE samples.
Data is obtained by observing or asking people.
NO experimental manipulation.
Examples
Surveys, panels, conjoint analysis; can be cross-sectional or longitudinal.

Descriptive example: surveys
Ask a large sample of questions (e.g., what proportion would buy at different price points, which can produce a demand curve).
Quality tips
Include ATTENTION CHECK questions (an obvious answer catches inattentive respondents)
If too high, always abandon the data set.
Make the survey INCENTIVIZED (choices are realized with some probability, so people answer carefully)
Make sure respondents match the target demographics.
Wendys
Q1: Open-ended/free answer question (consumers freely express before rigidity)
Q2: Two-way question (are you in the market)
Q3 – 6: Degree/scale-based questions
Q9: Demographics (Demographic based segemntation!

Descriptive examples: Types of questions in surveys (DON’T NEED)
Types of Questions | Typical functions in consumer analysis | Example |
Two-way questions | Estimate demand at a given price | Suppose an iPhone Y is priced at $800. Would you buy it or not? A. Yes. B. No Different price points = what proportions of market will buy it → produce demand curve |
Degree-type questions | Estimate purchase intention Estimate the importance of an attribute | How likely would you purchase it? 1-No 2-Probably not 3. Maybe 4-Probably 5-Yes How important is this feature to you? 1-Not at all 2-Slightly 3-Moderately 4-Very 5- Absolutely |
Ranking-type questions | Estimate the importance of attributes → Directly compare price, design, etc. Screen against one another | How would you rank the importance of the attributes below? (from the most important to the least important) |
Free-answer questions | Explore non-directed, non-structured preferences; ask for suggestions; follow-up (reason why, other). | What features do you look for when you purchase...? Why do you care about these features? Follow-ups, other Suggestions, break. Free from rigid choice options! |

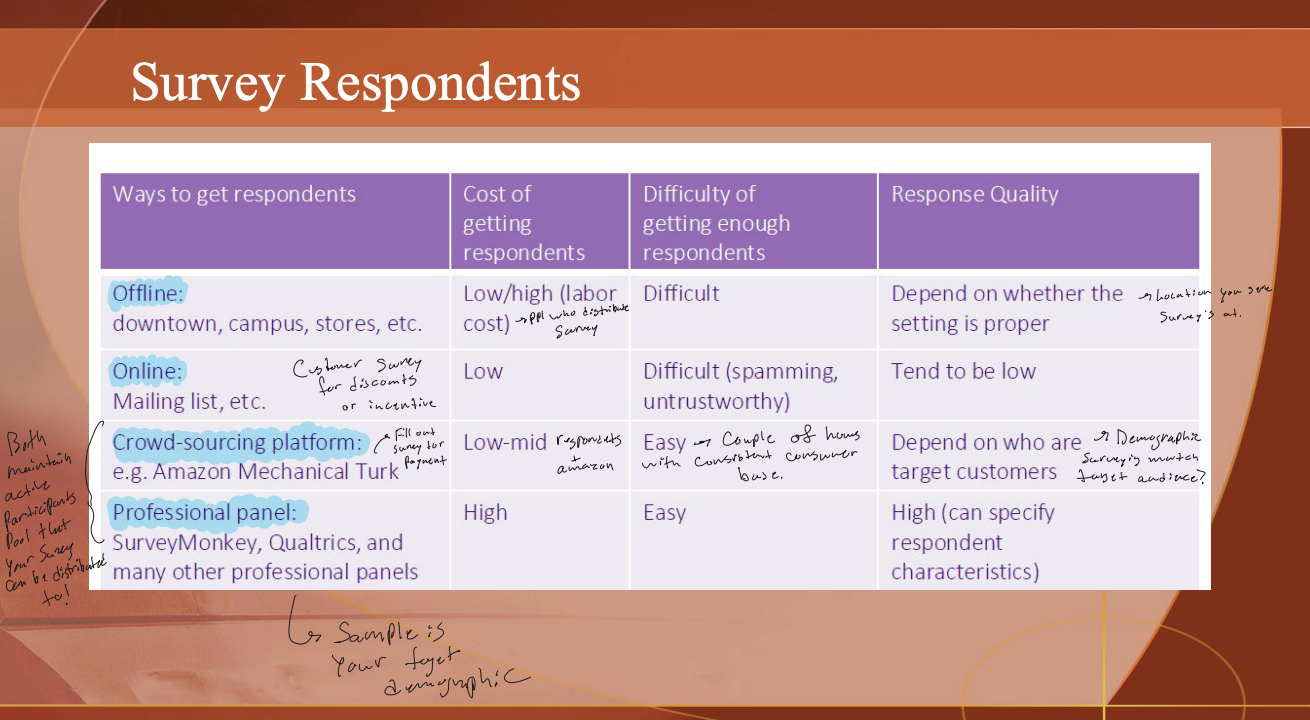
Descriptive examples: Survey respondents
Ways to get respondents | Cost of getting respondents | Difficulty of getting enough respondents | Response Quality |
Offline: downtown, campus, stores, etc. | Low/high (labor cost from ppl who distribute survey) | Difficult | Depends on whether the setting is proper |
Online: Mailing list, etc. (Customer survey for discounts or incentive) | Low | Difficult (spamming, untrustworthy) | Tend to be low |
Crowdsourcing platform: e.g. Amazon Mechanical Turk (Surveys 4 payment) | Low-mid (Responders + amazon) | Easy (Couple of hours with consistent consumer base). | Depends on who the target customers are (Demographic survey matches target audience) |
Professional panel: SurveyMonkey, Qualtrics, and many other professional panels (Sample is your target demographic) | High | Easy | High (can specify respondent characteristics) |
Descriptive example: conjoint analysis
A form of statistical analysis to understand how customers value the different components or features of a product or service.

Descriptive: cross-sectional vs. longitudinal (textbook)
Cross-sectional = data collected from a sample at ONE point in time (a snapshot).
Longitudinal = data collected from the same sample REPEATEDLY over time (e.g., panels), so you can track changes.
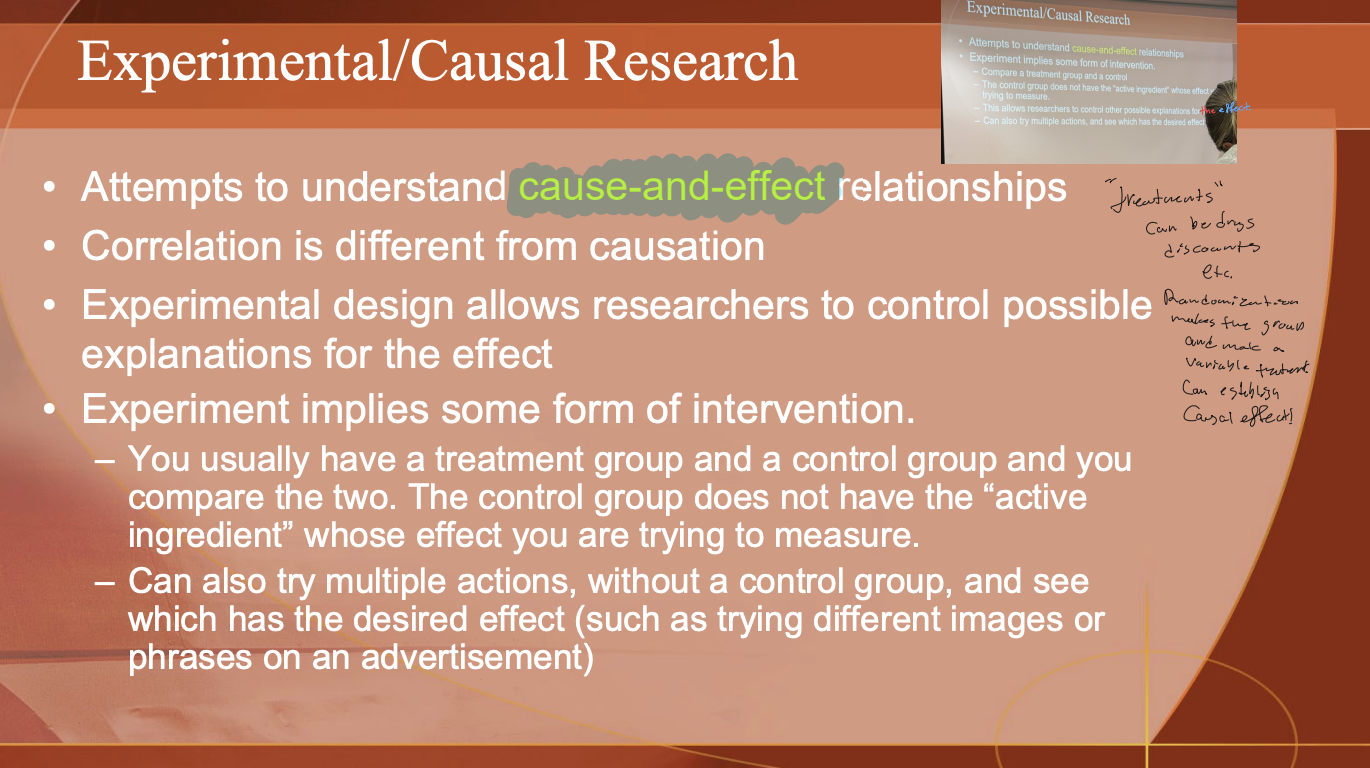
Experimental/causal research: definition and elements
Tries to establish CAUSE-AND-EFFECT relationships (correlation is not causation).
An experiment implies some form of intervention.
Compare a treatment group and a control group
The control group does not have the active ingredient whose effect is being measured.
This allows researchers to control other possible explanations for the effect.
Can also try multiple actions and see which has the desired effect
Experimental design lets researchers control other possible explanations for the effect.
Involves an intervention (a 'treatment').
Usually compares a treatment group with a control group, which lacks the 'active ingredient'.
Can also test multiple versions without a control group (A/B testing).
Types
Lab experiments and field experiments.
Experimental example: Jasper's Market ad test
Two versions of the same Facebook ad (apple pie photo vs. apple barrel photo).
Clicks were the same (8.3%), but conversion was 2.7% for the pie vs. 2.2% for the apples.
Use the pie photo: the experiment establishes a causal effect on purchase behavior.

Experimental example: Duolingo
Most users are free; the app is built like a game (XP, lives, streaks); ads with a premium option to remove them.
Runs A/B tests on its guilt-trip notifications (different messages to different people, like a 'slot machine bandit') to learn what works and what doesn't, using lots of free-user data.

Lab vs. field experiments
Lab experiment = run in a controlled, artificial setting (more control, less realistic).
Field experiment = run in a real-world setting such as a store or live ad (more realistic, less control).
Primary Research: Data Quality (Validity/Reliability/Representativeness).
Validity
The extent to which the research actually measures what it was intended to measure.
(New Coke had low validity: taste tests didn't measure why share was falling.)
Representativeness
Whether the sample is drawn from a population that represents the TARGET population.
The sample should represent the population you care about.
Reliability
Does the assessment tool produce stable, consistent results? Is it repeatable?
If the question were asked again under different conditions, would we get the same answer?

Research process Step 4: Develop findings
Turn data into information and insights
Enter, clean, and code the data (if needed)
Choose appropriate analysis techniques
Interpret the analysis.

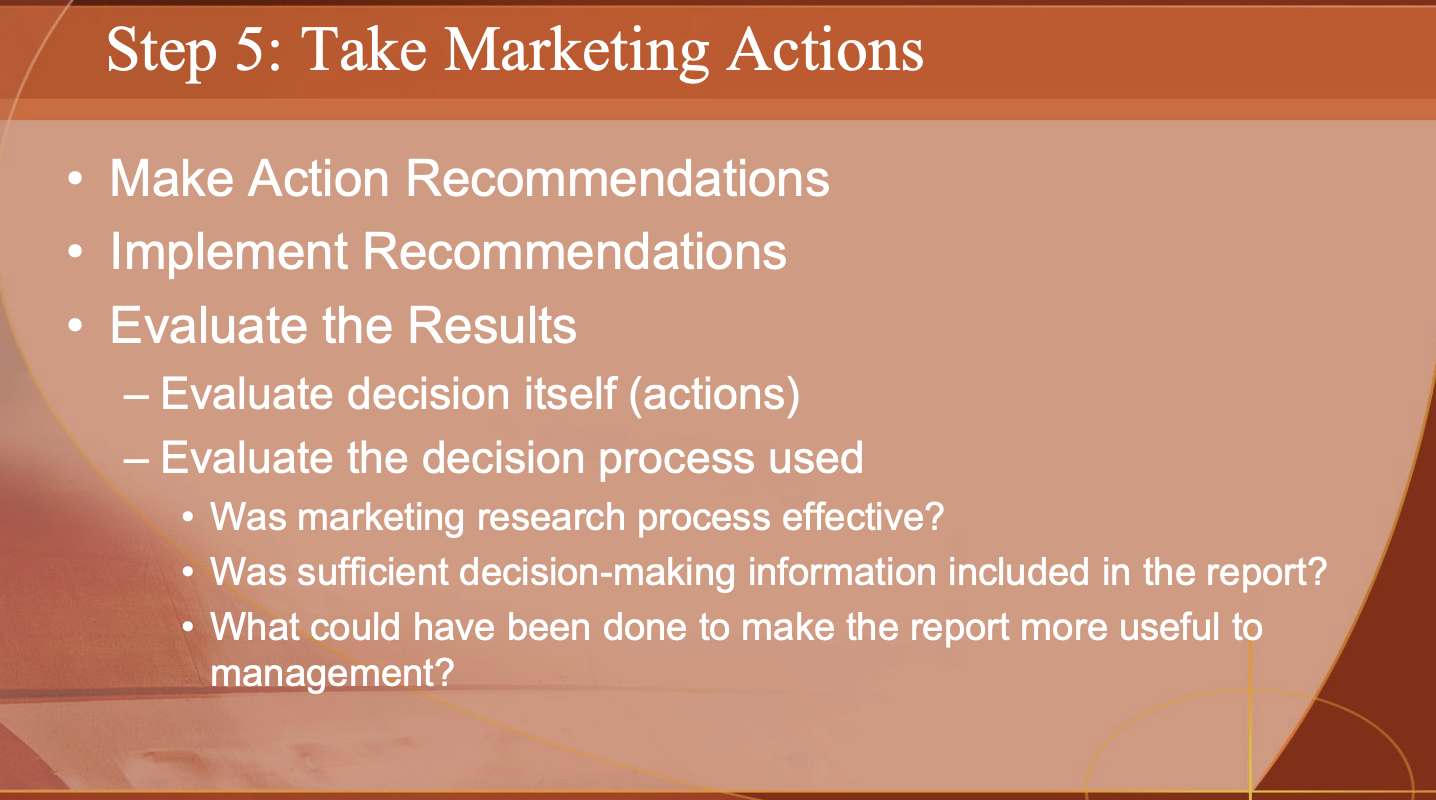
Research process Step 5: Take marketing actions
Make action recommendations, implement them, and evaluate the results.
Evaluate both the decision itself (the actions) and the decision process
Was the research process effective?
Was there enough decision-making information in the report?
What would have made the report more useful to management?
END OF CHAPTER 7
END OF CHAPTER 7
Product (definition)
Anything that satisfies consumer needs
Goods
A product with tangible attributes that you can own.
Services
Intangible activities or benefits an organization provides to satisfy consumers' needs. Does NOT involve ownership.
Ideas
A thought that leads to an action.
Even people can all be products.

The 4 I's of services (list) slide 276!
Intangible, Inconsistent, Inseparable, Inventory (perishable).

4 I's: Intangible/Inconsistent (variable/heterogeneous)
Intangible
Services can't be touched, seen, tasted, or felt the way goods can.
Inconsistent (variable/heterogeneous)
Services are less standardized and uniform than goods (heterogeneity).
Because they're labor-intensive, consistency and quality control are hard. Standardization and training help.
Not always bad: it allows customization to fit customers' needs.

4 I's: Inseparable/Inventory (perishable)
Inseparable
The consumer can't easily distinguish the service PROVIDER from the service EXPERIENCE itself.
Goods are produced, sold, then consumed; services are often sold, produced, and consumed at the same time, and consumers are often involved in producing them.
Inventory (perishable)
Services can't be stored, warehoused, or inventoried.
If supply > demand, the unused capacity's revenue is lost.
If demand > supply, it can't be built up ahead of time, so the opportunity is lost.

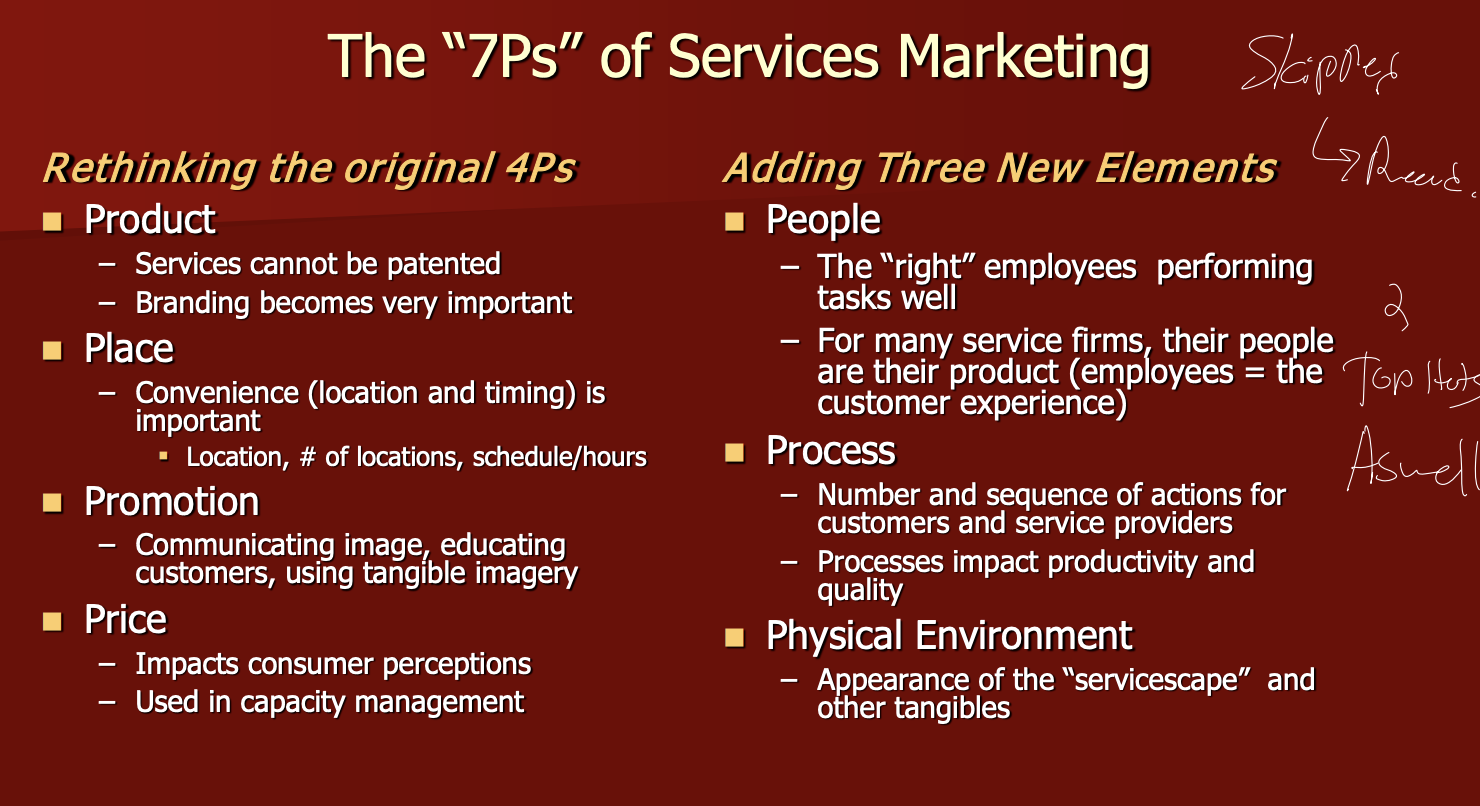
7 Ps of services marketing
The original 4 Ps rethought:
Product (can't be patented, so branding is key)
Place (convenience of location, number of locations, hours)
Promotion (communicate image, educate, use tangible imagery)
Price (shapes perceptions; used for capacity management)
Plus 3 new Ps
People (employees ARE the customer experience)
Process (number and sequence of actions; affects productivity and quality)
Physical environment (the 'servicescape' and other tangibles).
Layers of a product (list)
Core product (the benefit)
Inside → the actual product (the physical good or delivered service)
Inside x2 → the augmented product (extra support features).

Core product
The essential BENEFITS the product provides.
Someone buying a 1/2-inch drill bit wants a 1/2-inch HOLE.
Marketing is about supplying benefits, not products.
Car example
transportation, carrying cargo, excitement, image.

Actual product
The physical good or delivered service that supplies the desired benefit, including features, appearance, styling, packaging, quality, and brand.
E.g., the drill is a plastic-and-metal apparatus with a motor
For a car: engine size, color, body style, model name.

Augmented product
The actual product PLUS supporting features that add value
Warranty, credit, delivery, installation, repair/service after the sale, customer support, instructions.
TV example
TV is for entertainment (core). Warranty and delivery/install (augmented)

Layers of a service product: Pittsburgh Penguins example
Core = entertainment
Actual = Pens hockey games, the Penguins brand, PPG Paints Arena.
Augmented = customer service and information (website, programs).

Consumer vs. business products
Classified by how they're USED.
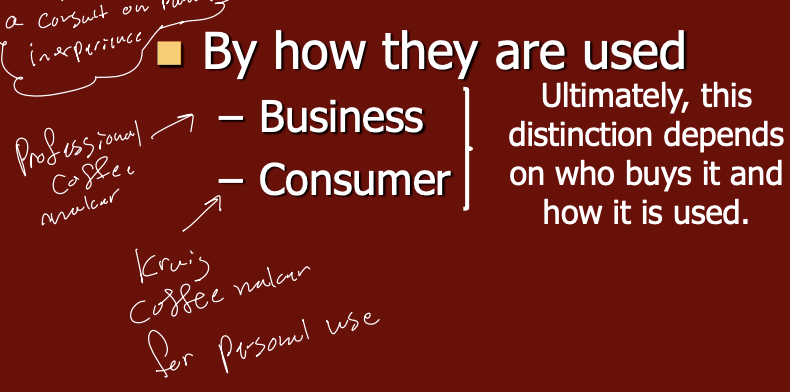
Consumer products are for personal use
Business products are for use by an organization.
It depends on who buys it and how it's used
A Keurig for personal use is a consumer product
A professional coffee maker for an office is a business product.
Durable vs Nondurable products
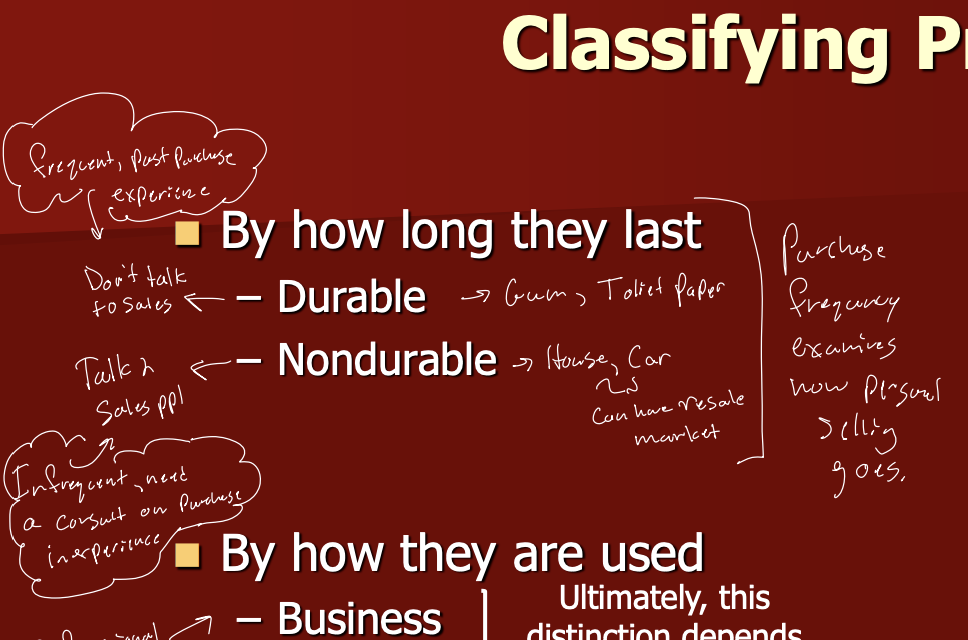
Durable
Products that LAST over many uses (e.g., house, car, appliances). They can have a resale market.
Bought INFREQUENTLY, and buyers are less experienced, so they often consult salespeople, and personal selling matters more.
Nondurable
Products consumed in one or a few uses (e.g., gum, toilet paper).
Bought FREQUENTLY, and buyers have plenty of past experience, so there's little need to talk to salespeople.
Consumer product types: how consumers buy them (list)
Convenience, shopping, specialty, unsought.

Convenience products
Items consumers buy frequently, conveniently, and with MINIMAL shopping effort.
E.g., gum, milk, toilet paper.

Shopping products
Items for which consumers COMPARE several alternatives on price, quality, style, amenities, etc. They don't buy immediately.
E.g., appliances, cars, cameras, airline tickets.
Best Buy Ad where they ask lots of questions about all the dimensions of a product

Specialty products
Products the consumer has developed strong preferences for.
They insist on a particular brand and will NOT accept substitutes, as the brand name is very important.
Depends on the individual
A Mercedes for someone loyal to Mercedes (they won't consider other cars even if those have better attributes), or Apple tech for an Apple-loyal buyer.
If you don't care about the brand, the same car is a shopping product.

Unsought products
Products consumers have little awareness of or interest in until a need arises; they don't know about them or don't initially want them.
Require lots of advertising, personal selling, and education.
E.g., health care, life insurance (e.g., targeting new parents), retirement investing, funeral services.
“life insurance so good they’ll want you dead” Ad

Product item
A specific product with a unique brand, size, or price.
Each product item is a separate SKU (stock-keeping unit), a unique ID number for internal inventory management.
SKUs are created by the retailer and vary across businesses.

Product line
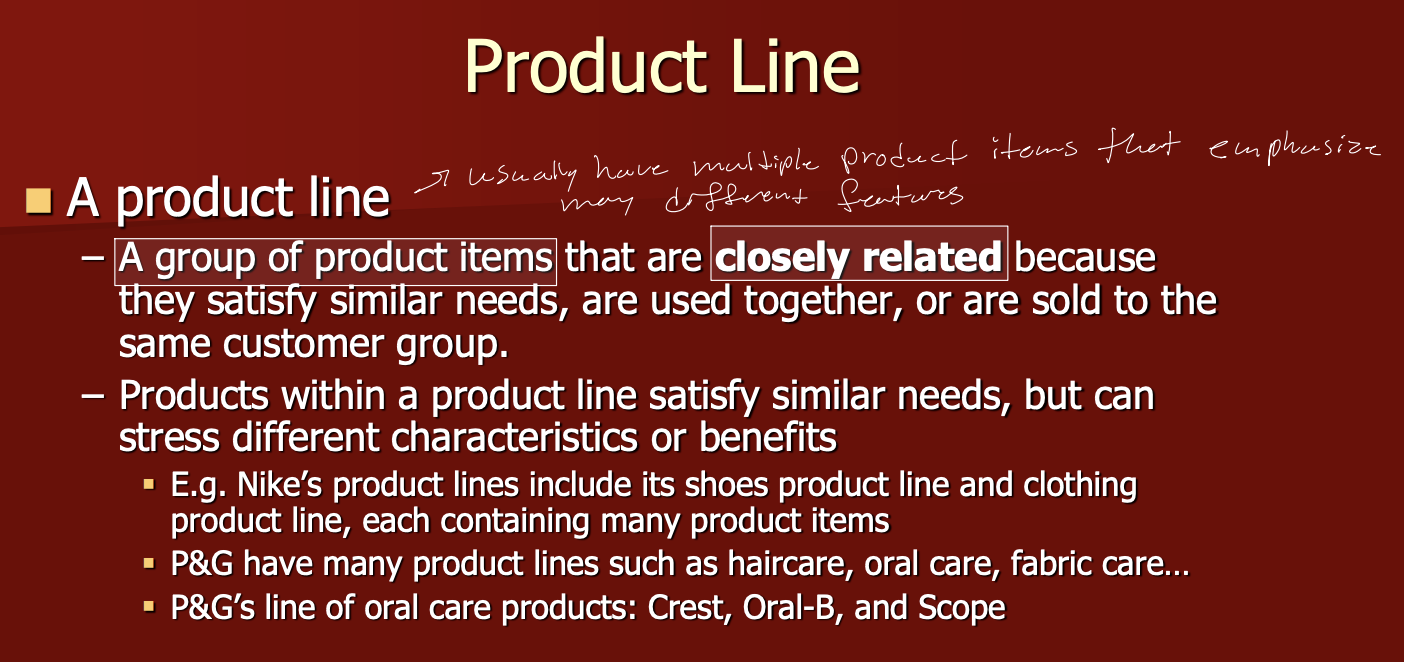
A group of product items that are closely related because they satisfy similar needs, are used together, or are sold to the same customer group.
Items can stress different features or benefits. Similar products, solving a similar need, which are similarly used by consumers.
Nike shoes and Nike clothing
P&G oral care: Crest, Oral-B, Scope.
Product mix
A firm's ENTIRE range of product lines (all lines and items).
E.g., Mars: candy, pet food, food, pet care, nutrition/supplements.
Strategic mix decisions usually involve the width of the product mix.

Line depth and Mix width
Line Depth
The number of different product items WITHIN one product line
(e.g., the number of P&G hair care items: Pantene, Head & Shoulders, Aussie…).
Mix Width
The number of different product LINES the firm produces (
e.g., P&G: fabric care, hair care, baby, health…).
Strategic mix decisions usually involve the width of the product mix.

Innovation continuum (newness from the consumer's perspective)
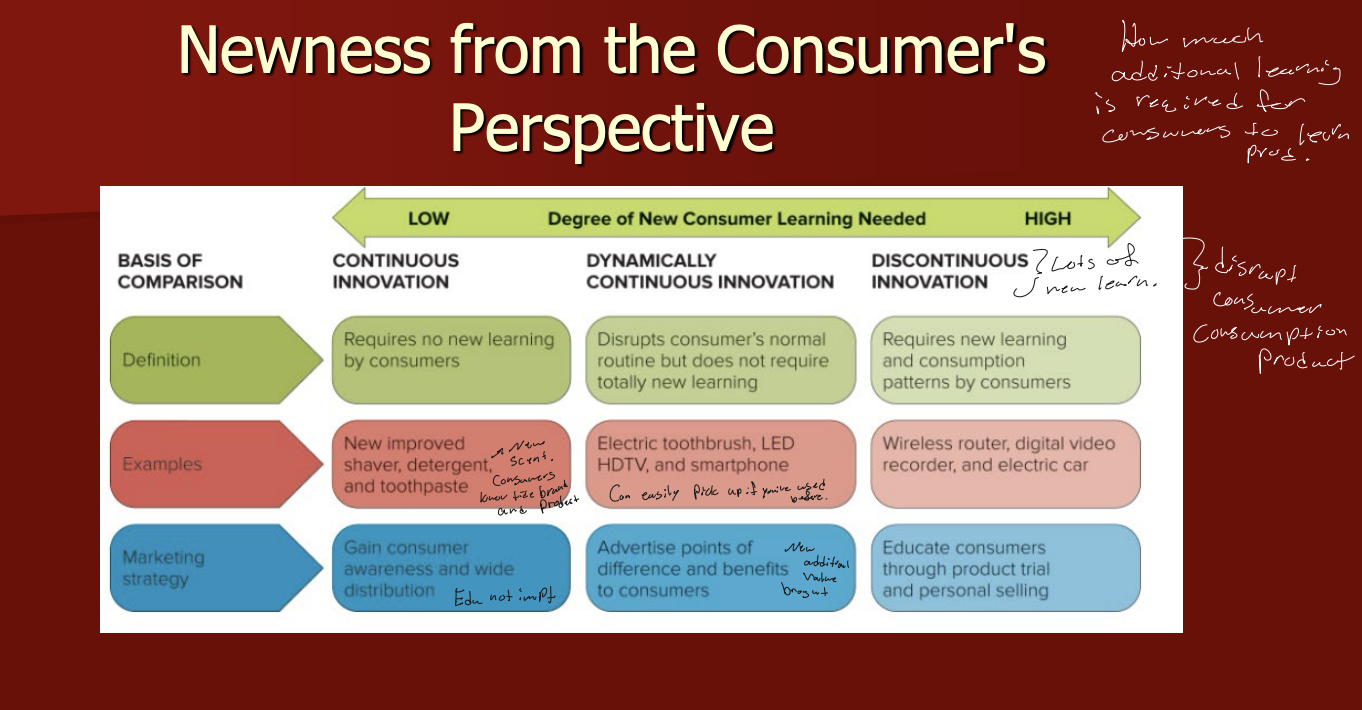
Ranks new products by how much NEW LEARNING consumers need, from low to high: continuous, then dynamically continuous, then discontinuous innovation.
Continuous innovation
Requires NO new learning by consumers.
E.g., new and improved shaver, detergent (a new scent of Tide), toothpaste.
Marketing strategy: gain consumer awareness and wide distribution (education isn't important).

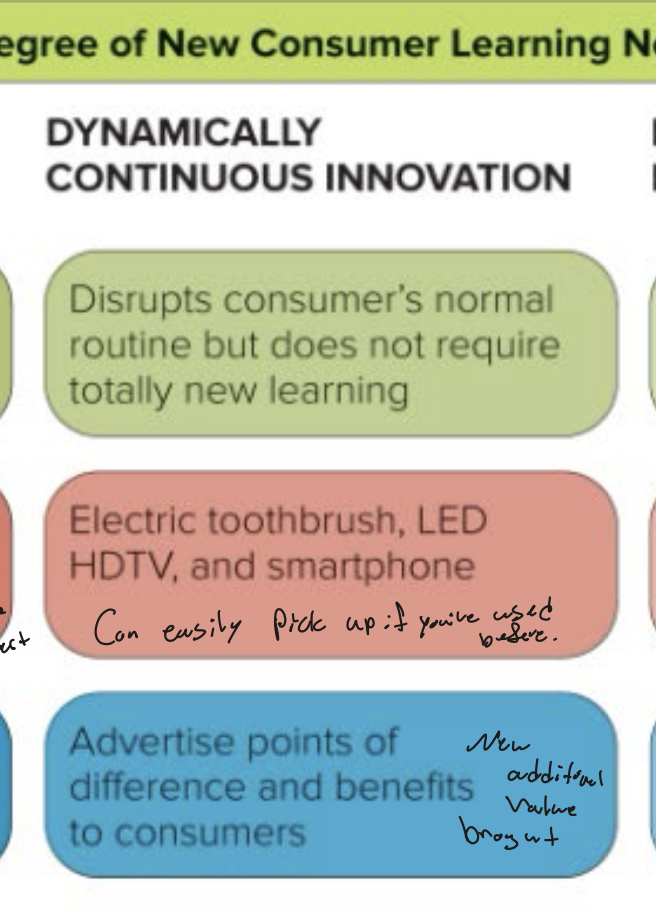
Dynamically continuous innovation
Disrupts consumers' normal routine but does NOT require totally new learning. Easy to pick up if you've used the earlier version.
E.g., electric toothbrush, LED HDTV, smartphone.
Marketing strategy: advertise points of difference and benefits (the additional value).
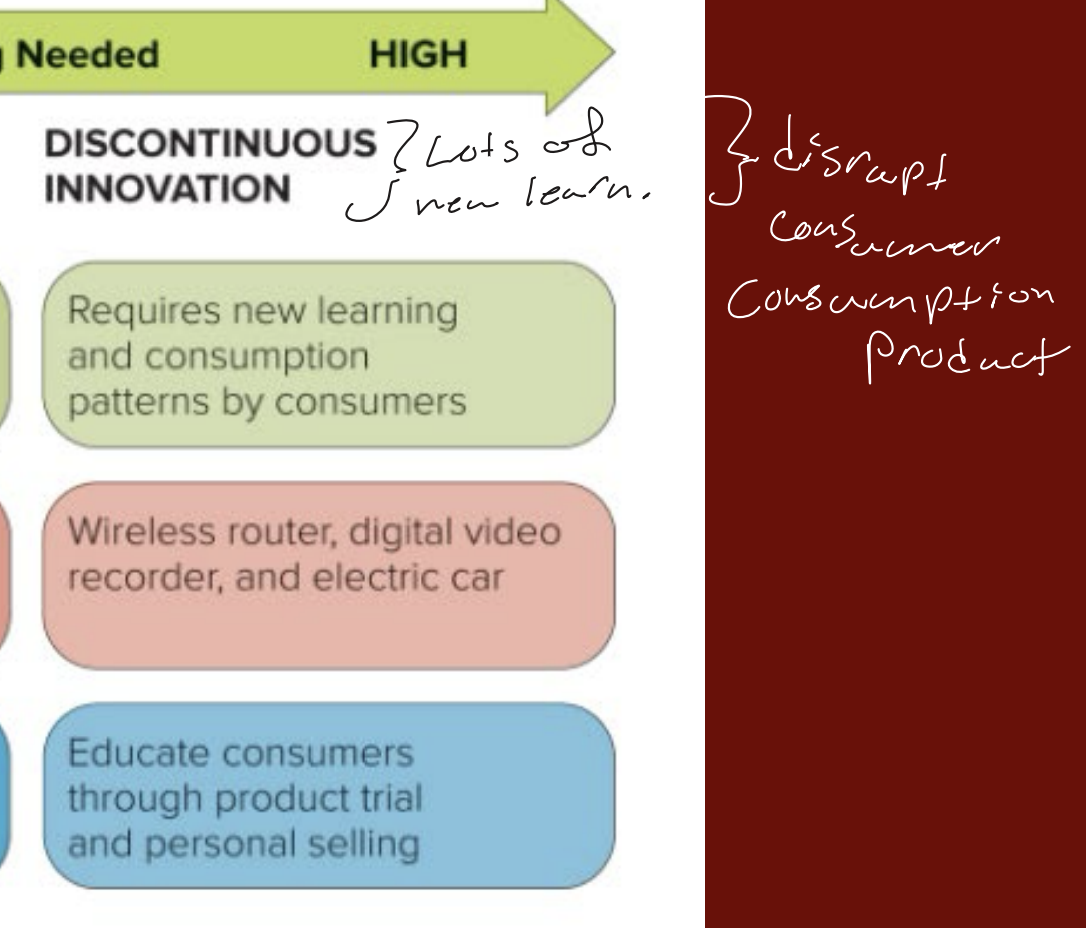
Discontinuous innovation
Requires NEW learning and new consumption patterns by consumers.
E.g., wireless router, digital video recorder, electric car.
Marketing strategy: educate consumers through product trial and personal selling.
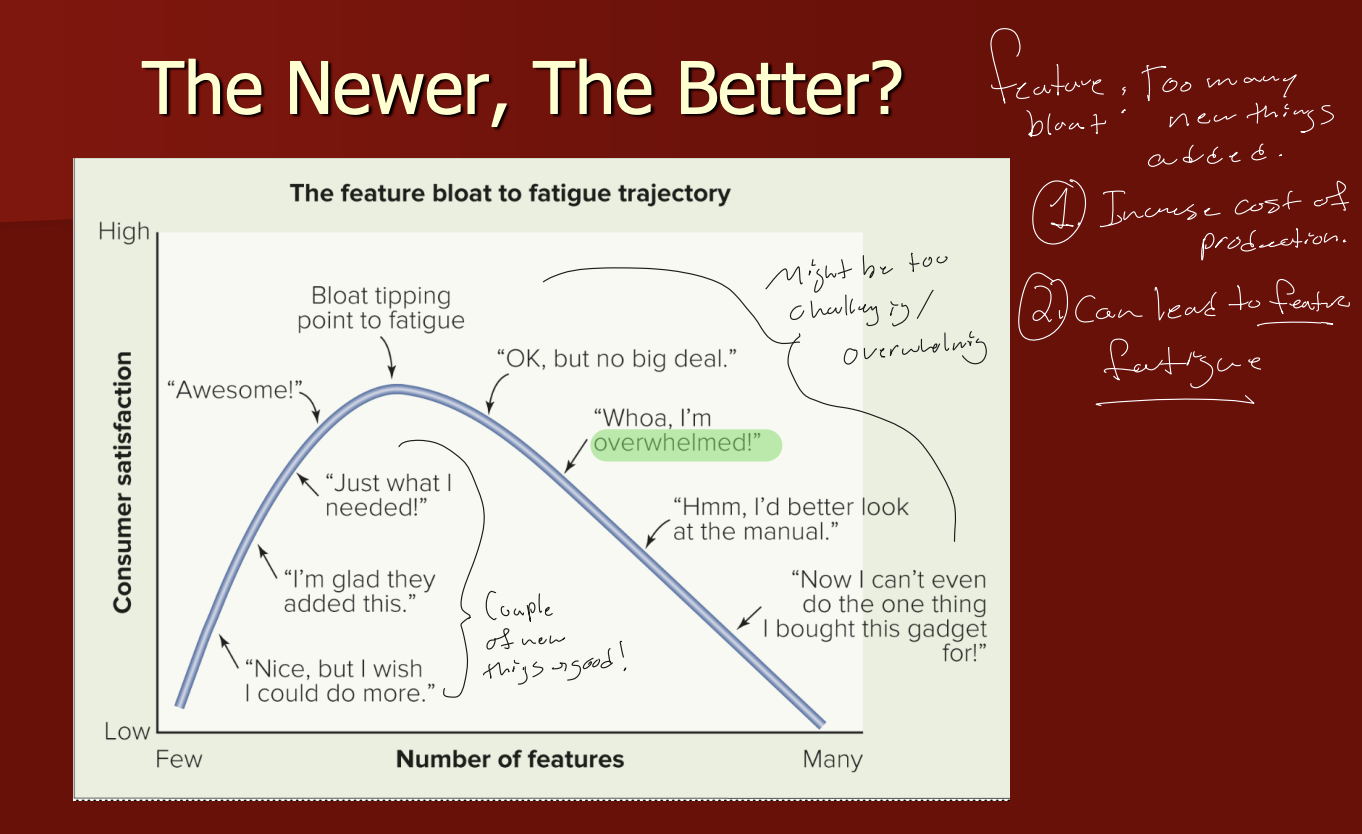
Feature bloat and Feature fatigue
Adding too many new features to a product.
Raises production costs and can make the product overwhelming and challenging to use, leading to feature fatigue.
Fatigue
Consumer satisfaction rises as useful features are added (a couple of new things are good).
Peaks at the 'bloat tipping point', then FALLS as more features overwhelm users ('Whoa, I'm overwhelmed!', 'Now I can't even do the one thing I bought this for!').
New product development process: the 7 stages
New product strategy development.
Idea generation.
Screening and evaluation.
Business analysis.
Product development.
Market testing.
Commercialization.

Should every idea go through all 7 NPD steps?
No. The process is a funnel meant to FILTER ideas.
As soon as we realize an idea isn't good, we should stop and save our resources.
NPD Stage 1: New-product strategy development + NPD Stage 2: Idea generation
1 - Define the role of new products for the firm; analyze the environment and competition.
2- Develop a pool of new ideas.
Sources: customers, salespeople, service providers, anyone with direct customer contact, competitors, supply chain members, the R&D division, consultants.

NPD Stage 3: Screening and evaluation
Quickly ELIMINATE ideas that are inconsistent with the organization's strategy or inappropriate for other reasons (e.g., technical feasibility, consumer reactions).
Use CONCEPT TESTS.
A test to evaluate a new-product idea, usually BEFORE any prototype exists (saves unneeded spending).
Present a concept statement (text description) to potential buyers or users to get their reactions.
Findings help predict sales and profit potential.
A positive reaction doesn't guarantee success but is an indicator
A strong negative reaction is a sign to redesign or abandon.

NPD Stage 4: Business analysis
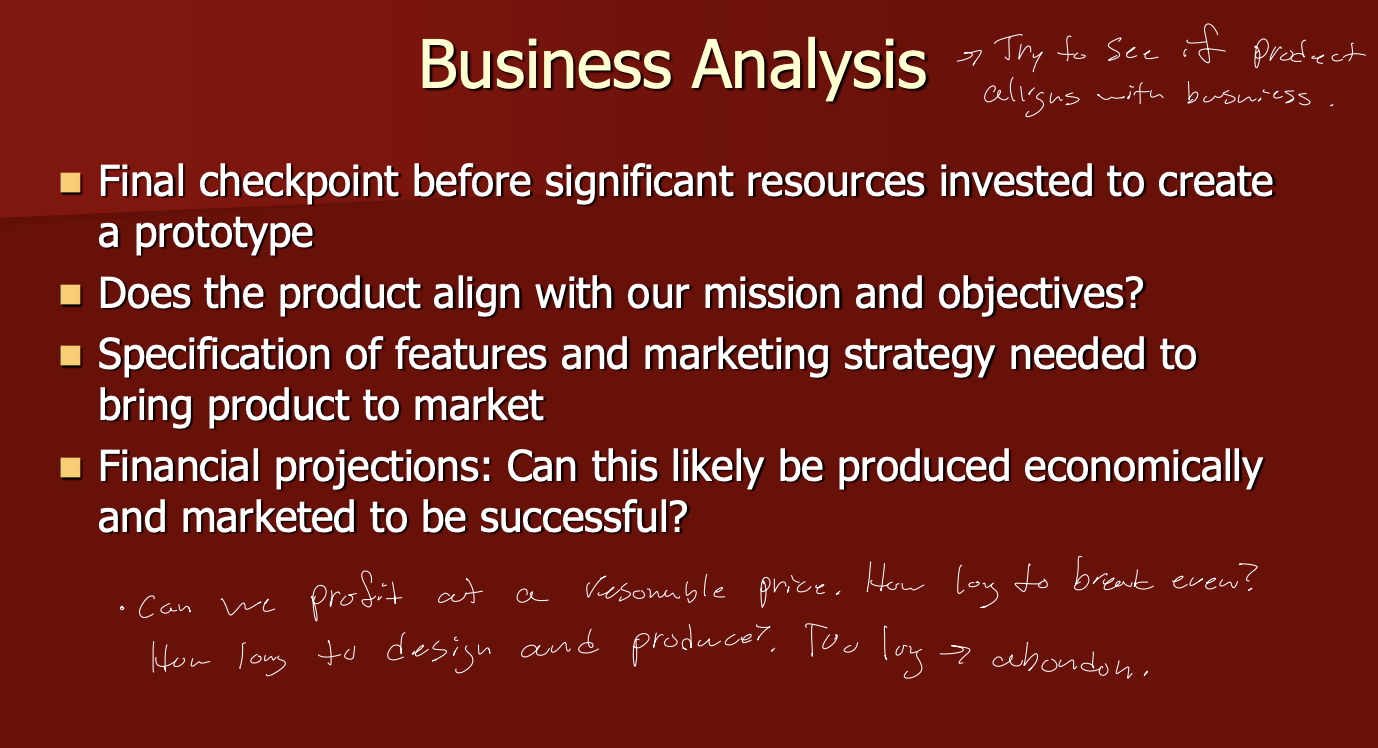
The final checkpoint before significant resources go into building a prototype.
Does the product align with our mission and objectives?
Specify the features and marketing strategy needed.
Financial projections: can it be produced economically and marketed successfully? How long until break-even?
NPD Stage 5: Product development
Turns the idea on paper into PROTOTYPES (full-scale operating models).
Refine the design and production process.
Evaluate prototypes with prospective customers to make sure the product meets standards
Apple tested 25+ mouse prototypes
Apply for a patent if applicable.

NPD Stage 6: Market testing
Exposing actual products to prospective consumers under (somewhat) realistic purchase conditions to see how they react.
Three types: standard, controlled, and simulated test markets.

Standard test market
MOST REALISTIC.
Actually launch the product, but only in select cities that are similar to the larger target market, testing the complete marketing plan (product, price, place, promotion).
Downsides: expensive, and it lets competitors see and evaluate your product.
KFC potato bowl in Pittsburgh

Controlled test market
Contracting the entire test program to an OUTSIDE SERVICE (a research firm works with retailers to put the product on shelves).
Guarantees some distribution during the test and tends to be less expensive, but still gives competitors exposure and is not as accurate.

Simulated test market
The most controlled option: a lab set up as a simulated retail space.
Cheapest, and minimizes or eliminates competitors seeing the product, but less realistic and less accurate than a standard test market.

NPD Stage 7: Commercialization
Finalize the positioning, pricing, distribution, and promotion needed for roll-out, then LAUNCH: full-scale production, regional rollouts.
Shein growth exmaple
How Shein innovated and leveraged their position in test markets
High turnover rate with a small-batch model → “on-demand”
The platform monitors demand and adjusts manufacturing/suppliers as a result. “Don’t carry excess waste” applies in the factory, but not in terms of consumer waste.
Innovative market testing: real-time, small-batch testing to identify prominent trends and the success of which items are selling!

END OF CHAPTER 9
END OF CHAPTER 9
Product life cycle (PLC)
Describes the stages a product goes through in the marketplace (how its sales revenue changes over time): introduction, growth, maturity, decline.
Marketing strategy must change as a product moves through the PLC.
Before introduction comes product development: no sales, only development costs.

PLC: Introduction stage
Full-scale launch into the marketplace.
Sales are low, and the failure rate is high; marketing and production costs are high (profits are negative).
If the product is innovative
Little competition
Promotion focuses on building product awareness and stimulating PRIMARY demand (for the category), not selective demand.

PLC: Growth stage
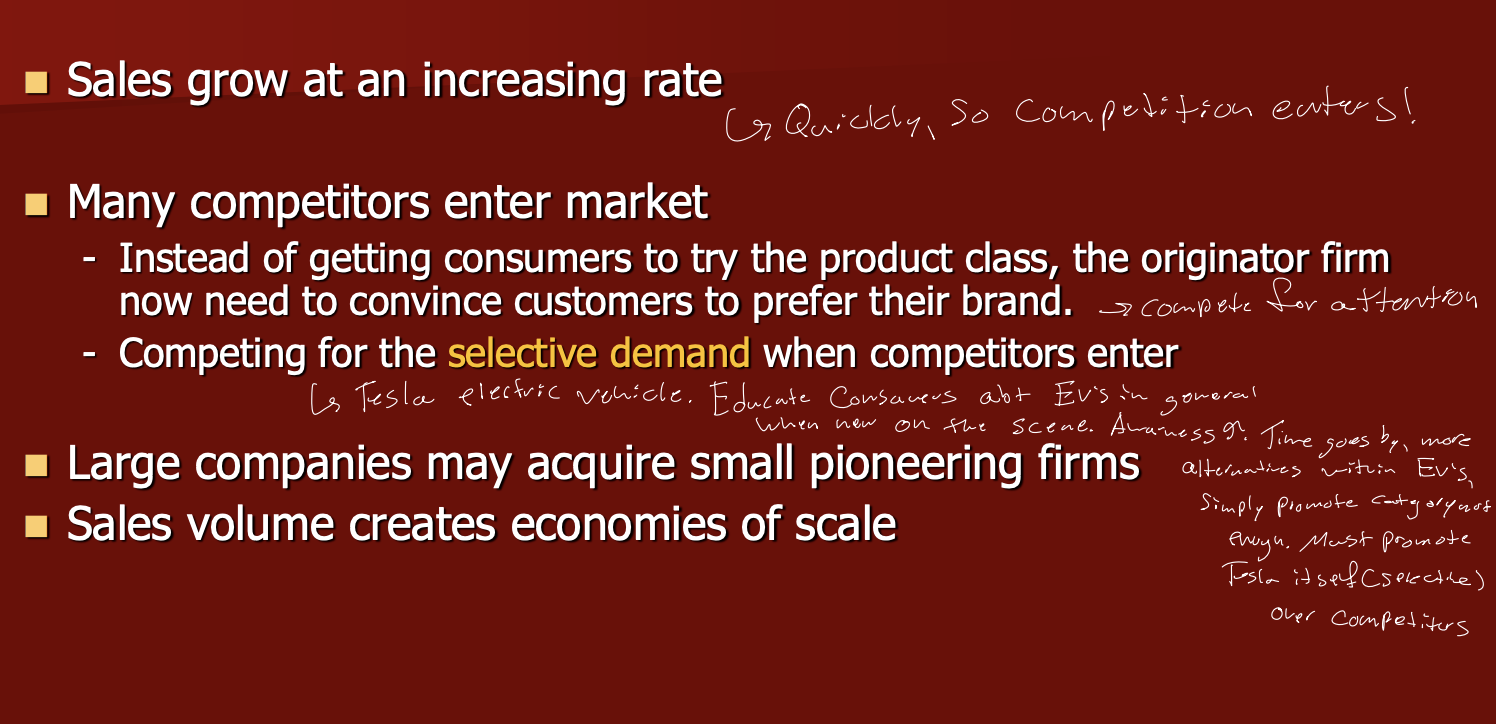
Sales grow at an increasing rate, so many competitors enter.
The originator must now convince customers to prefer ITS brand: competing for SELECTIVE demand.
Large companies may acquire small pioneering firms; sales volume creates economies of scale.
Profits peak. (Tesla first had to educate people about EVs in general; once more EVs arrived, it had to promote Tesla itself.)
Primary demand vs Selective demand
Primary demand
Demand for the product CATEGORY or class as a whole (e.g., getting people to want EVs in general).
The focus in the introduction stage.
Selective demand
Demand for a SPECIFIC BRAND within the category (e.g., getting people to want a Tesla over other EVs).
The focus once competitors enter in the growth stage.
PLC: Maturity stage
Sales increase very slowly or plateau as the market approaches saturation (most consumers already own the product).
Typified by annual models that emphasize style over function, heavy promotions, and falling prices and profits.
Can be passed through quickly (fashions, trends) or last a long time (soft drinks, staples).

PLC: Decline stage
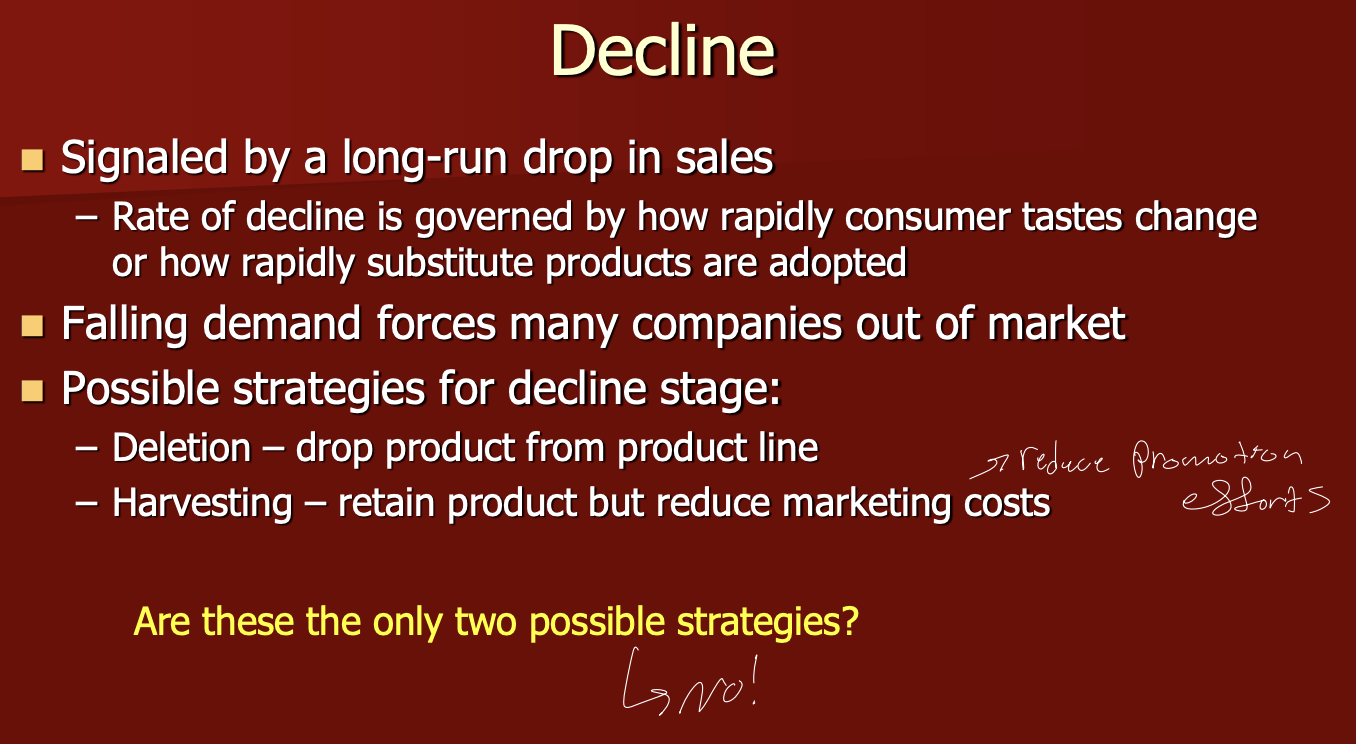
Signaled by a long-run drop in sales.
The rate of decline depends on how fast consumer tastes change or how fast SUBSTITUTE products are adopted.
Falling demand forces many companies out.
Strategies
Deletion
A decline-stage strategy: DROP the product from the product line.
Harvesting (or the PLC management strategies).
A decline-stage strategy: KEEP the product but REDUCE marketing costs (cut promotion efforts).
Technological innovation and PLCs
A product's life cycle can be cut short by new technology in the market: cassette tapes were replaced by CDs, which were replaced by digital music and streaming.

Alternative PLCs: Fad, fashion, classic, slow starter
Fad
Quickly popular, then quickly uninteresting: a sharp rise and sharp fall.
Fashion
Seasonal demand with multiple peaks: it rises, declines, and comes back.
Classic
An innovative product that survives the introduction stage and then keeps steady sales for a long time.
Slow starter
A prolonged introduction with low sales before a big boom.
E.g., the Stanley Quencher: launched in 2016 to Stanley's traditional outdoorsy male customer base, sold poorly, and was nearly dropped in 2019, then took off from 2020-2023 after a major marketing change.

Are deletion and harvesting the only decline-stage options?
No. Firms can also manage the PLC by modifying the product, modifying the market, or repositioning the product (e.g., Stanley Quencher).

Managing the PLC: modifying the product
Alter one or more of the product's characteristics to increase its value to customers and increase sales.
Stanley added new pastel colors, custom options, and collabs.

Managing the PLC: modifying the market
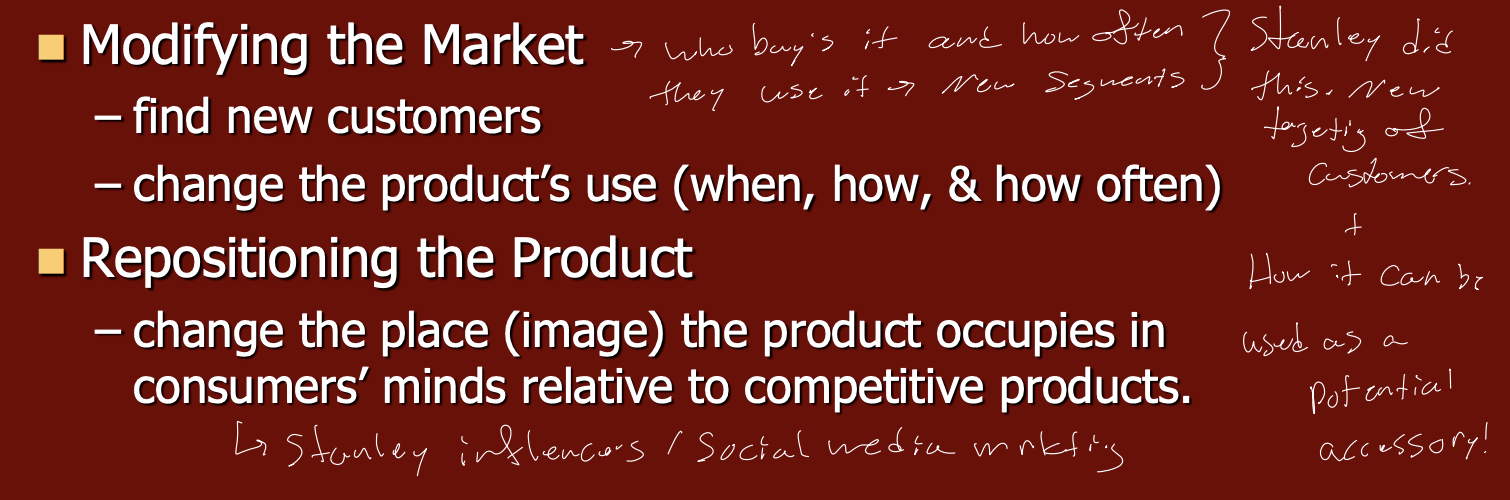
Change WHO buys it and how often they use it: find new customers (new segments), or change the product's use (when, how, and how often).
Stanley targeted new customers (women) instead of outdoorsy men.

Managing the PLC: repositioning the product
Change the place (image) the product holds in consumers' minds relative to competitors.
Stanley used influencer and social media marketing to reposition the Quencher from a rugged outdoor tool to a fashionable accessory and lifestyle brand.
Adoption Vs. Diffusion
Adoption
The process by which a consumer or business customer BEGINS to buy and use a new good, service, or idea.
Diffusion
How the use of a product SPREADS throughout a population, i.e., how it's gradually adopted across the population.

Adopter categories (list, in order)
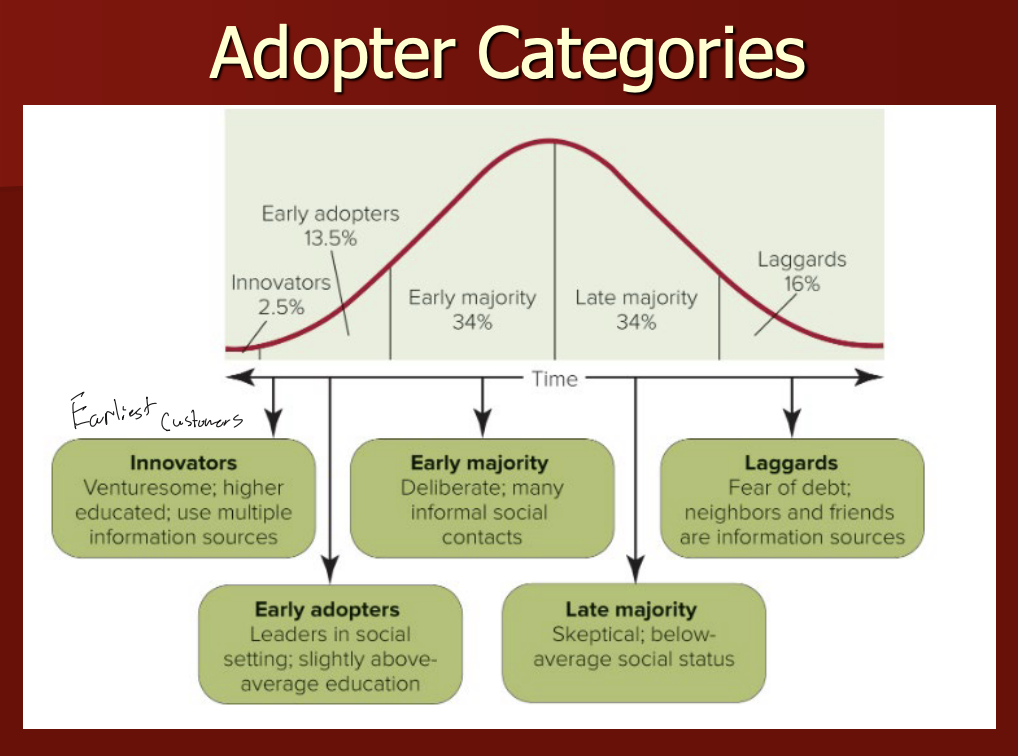
Innovators (2.5%), Early adopters (13.5%), Early majority (34%), Late majority (34%), Laggards (16%).
Innovators
About 2.5%; the FIRST to accept a new idea or product.
Venturesome and willing to take risks; higher education.
Rely heavily on IMPERSONAL information sources because little user experience or word of mouth exists yet.

Early adopters
About 13.5%; adopt after innovators but before the mainstream.
Respected as trendsetters and OPINION LEADERS whose recommendations influence many others; help a product move from a niche to a broader audience.
Stanley example: The Buy Guide (a group of moms/women influencers) adopted the Quencher early in 2019, and their posts caused an early boom.

Early majority vs. Late majority
Early
About 34%; adopt BEFORE the mean time of adoption.
Deliberate and cautious compared with early adopters; many informal social contacts.
Late
About 34%; adopt AFTER the mean time of adoption. Generally older, more conservative, skeptical.
PEERS are their primary information source. Wait until the product is a necessity and/or there's peer pressure to adopt.

Laggards
About 16%; the LAST to adopt.
Skeptical of change and resistant to new ideas; neighbors and friends are their information sources.
The product may already have been replaced by another innovation by the time they adopt.

Barriers to adoption affecting the diffusion process
Cold start problem
Getting the EARLY customers is often the hardest part of diffusion.
Usage barrier
The product is NOT COMPATIBLE with existing habits.
Value barrier
The product provides NO INCENTIVE to change (not enough added value over what consumers already use).
Risk barrier
PHYSICAL, ECONOMIC, or SOCIAL risks of using the product.
Psychological barrier
E.g., CULTURAL differences or IMAGE concerns.

Brand (definition) + What does a brand mean to a consumer? + The role of the brand (2 parts).
A name, term, symbol, logo, or any other unique element that identifies one firm's product(s) and sets it apart from the competition.
It's the COMBINATION of these, not one by itself.
It's a SIGNAL or a PROMISE (hopefully of quality).
Consumers make assumptions about reliability and trust based on the brand.
Role
(1) Signaling information about the PRODUCT (quality, reliability).
(2) Signaling information about CONSUMERS themselves (what owning it says about you).

Why is branding important? (the power of brands)
People pay more for exactly the same thing because they TRUST the brand.
Consumers align or identify themselves with brands and may even defend a brand, treating an attack on the brand as an attack on themselves.
Brands also create brand equity and competitive advantage.

Brand personality
A set of HUMAN characteristics associated with a brand.
Consumers assign traits to products (traditional, romantic, sophisticated, rebellious) and choose brands consistent with their own or desired self-image.
E.g., Coca-Cola: all-American and authentic; Pepsi: young and exciting; Dr Pepper: nonconforming and unique.

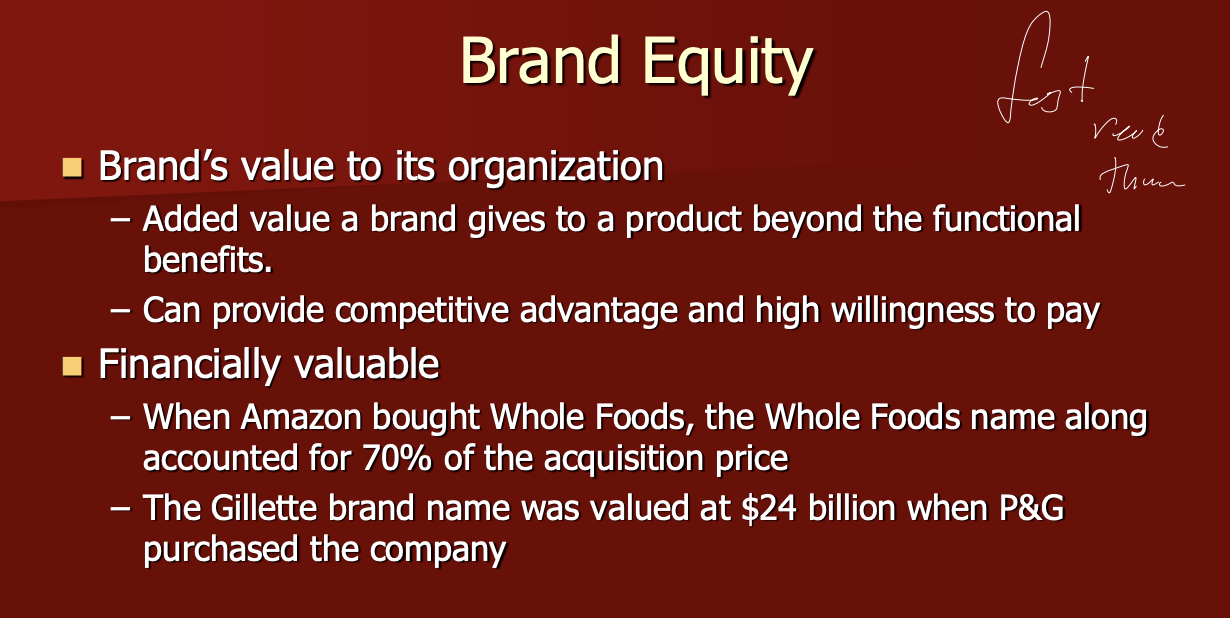
Brand equity
A brand's VALUE to its organization: the added value a brand gives a product beyond its functional benefits.
It can provide competitive advantage and a higher willingness to pay, and it's financially valuable (e.g., the Whole Foods name was a big part of Amazon's purchase price).
Branding strategies
Multiproduct (family/corporate branding)
Market ALL (or a group of) a firm's products under ONE umbrella brand.
Multibranding
EACH product has its OWN separate brand name (e.g., P&G's Tide, Gain, Downy).
Private label
The manufacturer brands its products under the RETAILER'S name. E.g., Costco's Kirkland, Whole Foods' 365.
Mixed branding
A firm markets products under its OWN brand names AND under the brand name of a RESELLER.

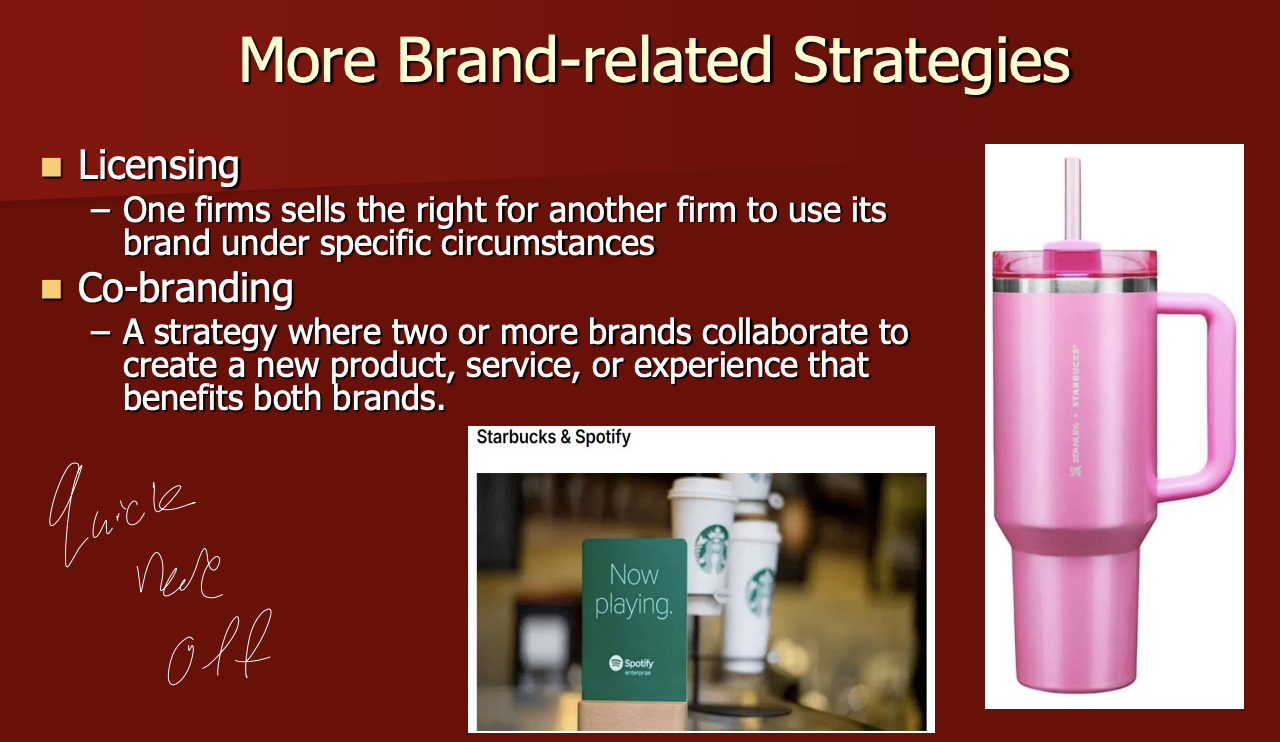
Licensing vs Co-Branding
Licensing
One firm SELLS THE RIGHT for another firm to use its brand under specific circumstances.
Co-branding
Two or more brands COLLABORATE to create a new product, service, or experience that benefits both brands.