STOR 455 R Interpretation
 Call Kai
 Learn
Learn Practice Test
 Spaced Repetition
 Match
Match Flashcards
 Knowt Play
1/122

There's no tags or description
Looks like no tags are added yet.
Name | Mastery | Learn | Test | Matching | Spaced | Call with Kai | Chat |
|---|
No analytics yet
Send a link to your students to track their progress
123 Terms

What is the P value and what does it signify here.
0.001471 and means that there is statistically significant evidence that the mean Amazon prices of Friends and Star Wars Lego sets differ.

What does 42.26 signify? What does 38.44 Signify? What is the equation for this code? What are the 2 separate equations for this code?
42.26- Mean for Friends
38.44- diffference in means
the regression equation is:
Y^=42.26+38.44Star Wars
For Friends: Y^=42.26+38.44(0)
For Star Wars: Y^=42.26+38.44(1)

What is the regresson equation? What are the 2 seperate equations.
Amazon_Price=−0.082759+0.143271Pieces+9.803090Theme
Friends: Amazon_PriceF=YF=−0.082759+0.143271Pieces
Star Wars: Amazon_PriceSW= 9.720331+0.143271Pieces
What does this equation look like on a graph : Amazon_Price=−0.082759+0.143271Pieces+9.803090Theme


What does this graph tell you about the equations of these lines
The equations have the same slope but different intercepts

What does this graph imply about the equations of this model?
The added a categorical variable/interaction term with different slopes

What are the equations for this model?
Amazon_Price=9.06395+0.11233Pieces−1.51114Theme+0.03532Pieces*Theme
FRiends: Amazon_PriceF=9.06395+0.11233Pieces
Star Wars: Amazon_PriceSW=7.55281+0.14765Pieces
Goal 1: Find a confidence interval to represent plausible parameter values
Goal 2: Test a hypothesis about a possible value of a parameter
bj±t∗⋅SE(bj)
bj = the slope of the equation
CI: Accounts for uncertainty in estimating the average response.
PI: Accounts for uncertainty in estimating the average response and the variability of an individual observation.
We are 95% confident that the true population slope lies between ???
What is H0 and HA for HYpothesis test for parameter value
H0:βj=0 here parameter is 0 (basically slop = 0)
HA:βj≠0 here parameter is not 0 (basically slop ≠ 0)
What is R? and whats the value range
measure the linear correlation between 2 variables -1 < r < 1
for the anova test : Data: The actual observed values.
Model: The part of the variation explained by the regression model.
Error: The part not explained by the model, represented by the residuals.
Partitioning variability of a simple linear model EQ
What is R^2 and what is the value range?
Residual formula
A small F-statistic suggests that the explained variation is not large compared with the unexplained variation.
A large F-statistic suggests that the explained variation is large compared with the unexplained variation.
What is a correlation Matrix? Strong correlations?
what does the SSModel represent in multiple regression
SSModel measures the explained variation explained by regression
What does SSE represent in multiple regression
SSE is the error after regression
F statistics and slop t test relationship?
Identify potential predictors of the response variable, Y.
Look for relationships among the predictor variables themselves.
The overall F-test asks whether the predictors as a group provide evidence of a useful relationship.
Each slope t-test asks whether one predictor provides evidence of a nonzero contribution after accounting for the other predictor.
Difference in test for correlation vs test for slope?
Test for correlation assesses the linear association between any two variables in isolation. the test for slope asses linear association with the response after accounting for other predictors in the model
a situation where 3 or more predictors are strongly associated with each other. used because individual coefficients and their t-test are deceptive and unreliable
1. Examine correlations between predictors or examine their R^2 values.
2. Compute the Variance Inflation Factor (VIF).
What to do to handle Multicollinearity?
Choose better predictors
Eliminate some predictors
Combine predictors
compares a model with only some predictors against the model containing all available predictors. Compares a smaller model with the full model
SSEm = SSE for the smaller model with mmm predictors.
MSEk = MSE for the full model with kkk predictors.
m = number of predictors in the smaller model.
k = number of predictors in the full model.
n = number of observations.
AIC and BIC formula interpreattion AIC=−2ln(L)+2k BIC=−2ln(L)+kln(n)
L = likelihood of the model, which measures how well the model fits the observed data.
ln(L) = natural logarithm of the likelihood.
k = number of model parameters, as used by the criterion.
n = number of observations.
Model fit: How well does the model fit the data?
Model complexity: How many parameters does the model use?
R's "Stepwise" and "Best Subsets" procedures will eliminate that case from ALL* models. Check for missing values in the full predictor pool before conducting model selection. Different handling of missing observations can lead to different selected models.
What are penalties?
Adjusts for the number of predictors k and sample size n
H₀: μ₁ = μ₂ (the population means are equal) Hₐ: μ₁ ≠ μ₂
How can we interpret the coefficient of Theme?
This is the Additional predicted price for Star Wars, compared with Friends, at the same number of pieces.

State the Hypothesis and make a conclusion about the p-value
H0:β2=0
HA:β2≠0H
Here, β2 is the coefficient for Theme.
H0: At the same number of pieces, there is no difference in predicted price between themes.
HA: At the same number of pieces, the predicted prices differ.
The p-value for ThemeStar Wars is 0.07890.07890.0789.
Therefore, we fail to reject H0H_0H0.
There is not enough evidence at the 5% significance level to conclude that Theme adds a significant difference in predicted price after accounting for Pieces in this common-slope model.
What is an interaction term?
The interaction term is the product of the two predictors. Without an interaction, both themes have the same slope.

Here what is the -1.51114 number represent? What does the Pieces:ThemeStar Wars number represent
ThemeStar Wars = -1.51114
This is the difference in intercepts between Star Wars and Friends.
Pieces: ThemeStar Wars = 0.03532
This is the crucial interaction coefficient.
It measures how much the Star Wars slope differs from the Friends slope.
What is the H0 and HA for the nested F-test
The null hypothesis says all the coefficients for the extra terms in the larger model are zero.
H0:Bi = 0
The alternative says at least one of those extra coefficients is nonzero.
HA: Bi≠0
What does RSS mean?
RSS stands for residual sum of squares. It measures the total squared differences between observed prices and predicted prices.

Given the reduced model and full model. Is the model with Theme and different slopes better than the model with Pieces alone? What is H0 and HA?
Y=β0+β1X1+ε
Y=β0+β1X1+β2X2+β3X1X2+ε
H0: Neither Theme nor the interaction adds value beyond Pieces alone.
HA: At least one of them adds value.
There is statistically significant evidence that adding Theme and the interaction together improves the model compared with using Pieces alone.
Given common slope and different slope equations? Is the model with different slopes better than the model with a common slope? What is H0 and HA?
Y=β0+β1X1+β2X2+ε
Y=β0+β1X1+β2X2+β3X1X2+ε
H0:β3=0
HA:β3≠0 If we reject then there is evidence that the interaction improves the model, supporting different slopes. If we accept there is insufficient evidence that allowing different slopes improves the model.
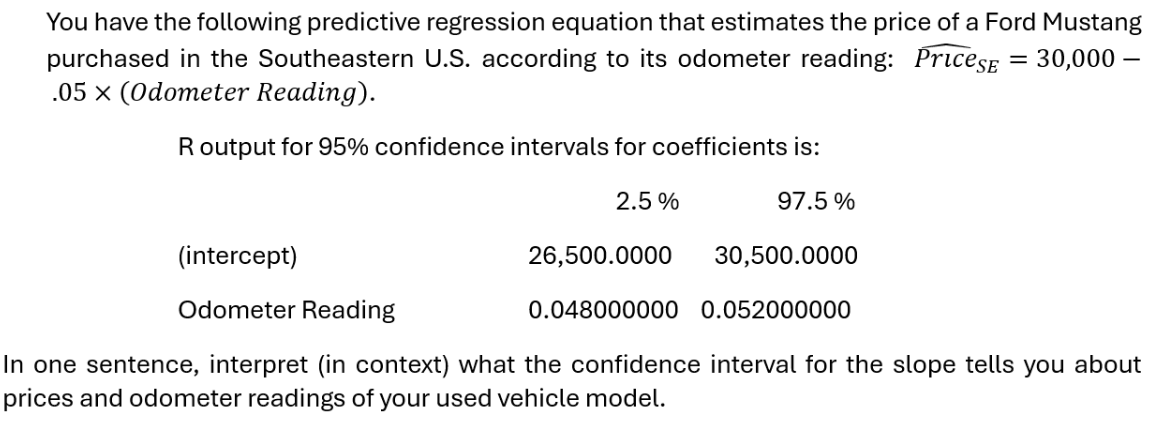
We are 95% certain that the true slope of the regression line is between -0.048 and -0.052

This is a prediction interval
• We have 95% confidence that the price of the particular Ford Mustang with 60,000 miles will fall between $25,000 and $29,000.

This is a confidence interval
• We have 95% confidence that the mean price of a Ford Mustang with 60,000 miles will fall between $25,000 and $29,000

Southeast Price= 30,000-.05 x (Odometer reading)
Prices are higher in California than in the Southeast for Ford Mustangs with low mileage (at zero miles, California Price = 34,000 while the same car costs $30,000 in the Southeast). However, the price in California declines more rapidly with milage than in the Southeast (-.75 vs -.05)
What is H0 and HA for t-test on slope for regular linear regression and interpret
H0: B1 = 0
HA:B1 ≠ 0
there is evidence of a linear relationship between X and Y. Report the slope with units and direction,
What is H0 and HA for t-test on corrrelation for regular linear regression and interpret
H0: p = 0
HA: p ≠ 0
there is evidence of a linear association, and the sign of r gives its direction
What is H0 and HA for t-test on ANOVA F test for regular linear regression and interpret
H0: B1 = 0
HA:B1 ≠ 0
at least one predictor is useful.
Approx Standardized residual formula?
y - y^ / OE
T-score for non-zero slope formula
𝛽𝑖 / 𝑆𝐸(𝛽𝑖)
Average Leverage formula
k+1 / n
What is a categorical variable?
A categorical variable puts observations into groups.
LEGO theme: Friends, Marvel, Star Wars, DOTS.
Weather: No Precipitation, Drizzle, Rain.
What does ordinal mean?
An ordinal categorical variable has categories with a natural, logical order or ranking.
Michelin star ratings: 1 star, 2 stars, 3 stars.
Military ranks: categories have an established order.
Weather in this lecture: 1 = No Precipitation, 2 = Drizzle, 3 = Rain.
For non ordinal categorical predictor what is the formula for number of indicator variables
If there are K categories, use K−1 indicator variables because we choose one as the reference group
What does each value mean in this equation?
^Amazon Price=−13.09+0.141(Pieces)+13.80DF+10.19DM+24.14DS
Intercept: −13.09
This is the predicted Amazon price for a DOTS set with zero pieces.
Pieces coefficient: 0.1410
Holding theme constant, each additional LEGO piece is associated with an estimated increase of 0.141 in Amazon price, in the price units used by the data. This is the common slope.
Friends coefficient: 13.80
At the same number of pieces, a Friends set is predicted to cost 13.80 more than a DOTS set.
What happens in the common slope model?
different categories can have different intercepts, but the quantitative predictor has the same slope for every category.
What are interaction terms and how are they used in unique slope models?
An interaction term multiplies two predictors together. Interaction terms allow the slopes to change.

Write the full equation for this and for the Friends Model?
^Amazon_Price = 3.225 + .0432𝑃𝑖𝑒𝑐𝑒s+ 5.839Tℎ𝑒𝑚𝑒𝐹r𝑖𝑒𝑛𝑑𝑠+
2.471𝑇ℎ𝑒𝑚𝑒𝑀𝑎𝑟𝑣𝑒𝑙 + 4.328𝑇ℎ𝑒𝑚𝑒𝑆𝑡𝑎𝑟 𝑊𝑎𝑟𝑠 + .0691𝑇ℎ𝑒𝑚𝑒𝐹𝑟𝑖𝑒𝑛𝑑𝑠 ×
𝑃𝑖𝑒𝑐𝑒𝑠 + .0752𝑇ℎ𝑒𝑚𝑒𝑀𝑎𝑟𝑣𝑒𝑙 × 𝑃𝑖𝑒𝑐𝑒𝑠 + .1044𝑇ℎ𝑒𝑚𝑒𝑆𝑡𝑎𝑟 𝑊𝑎𝑟𝑠 ×
Pieces
^𝐴𝑚𝑎𝑧𝑜n_𝑃𝑟𝑖𝑐𝑒F = 9.064 + 0.1123𝑃𝑖𝑒𝑐𝑒𝑠
What does wrapping the weather variable in factor R command do? factor(Weather)?
Wrapping Weather in factor() tells R to treat the numerical codes as category labels, rather than as quantitative values

Interpret the P value and what this means in the categorical model?
For Weather 2, the estimated mean is about 1.02 lower than Weather 1. The p-value is greater than 0.05, so we do not find statistically significant evidence of a difference between those two groups.
For Weather 3, the estimated mean is about 7.08 higher than Weather 1. The p-value is less than 0.05, so there is statistically significant evidence that those two group means differ.
How does R treat predictors in lm()
If a predictor in lm() has text values, R automatically treats it as categorical and creates indicators for all but one category.

Write the single regression equation and the indicator variable equations
^Amazon_Price = -13.09 + +0.141(Pieces) + 13.80ThemeFriends + 10.19ThemeMarvel + 24.14ThemeStarWars
^Amazon_PriceD =−13.09+0.141(Pieces)
^Amazon_PriceF=0.71+0.141(Pieces)
^Amazon_PriceM=−2.90+0.141(Pieces)
^Amazon_PriceSW=11.05+0.141(Pieces)
Is this equation common slope or unique slope ?
modelW4 <- lm(Annuli ~ Mass + factor(Weather), data = Turtles3)
common slope
Is this equation common slope of unique slope ?
modelW5int <- lm(Annuli ~ Mass + factor(Weather) + Mass * factor(Weather), data = Turtles3)
Unique slope