Chapter 2: Descriptive Statistics
 Call Kai
 Learn
 Practice Test
 Spaced Repetition
 Match
 Flashcards
 Knowt Play
1/94

There's no tags or description
Looks like no tags are added yet.
95 Terms
What are the two main types of data?
Categorical (qualitative) and numerical (quantitative).
What is nominal data?
Categorical data whose categories have no natural ordering.
What is ordinal data?
Categorical data whose categories have a meaningful order.
Which averages make sense for nominal data?
Mode only; mean and median are not meaningful.

Which averages make sense for ordinal data?
Mode and median; the mean is generally not meaningful.

What is discrete numerical data?
Numerical data with separated possible values, often counts.
What is continuous numerical data?
Numerical data that can theoretically take any value in an interval.
What distinguishes ratio data from interval data?
Ratio data have a meaningful natural zero; interval data do not.
What five features should you examine when describing a distribution?
Location, spread, shape, outliers, and other unusual features (such as distinct groups or unexpectedly frequent values).
What does location describe?
The centre or typical value of a distribution.
What does spread describe?
How variable or dispersed the observations are.
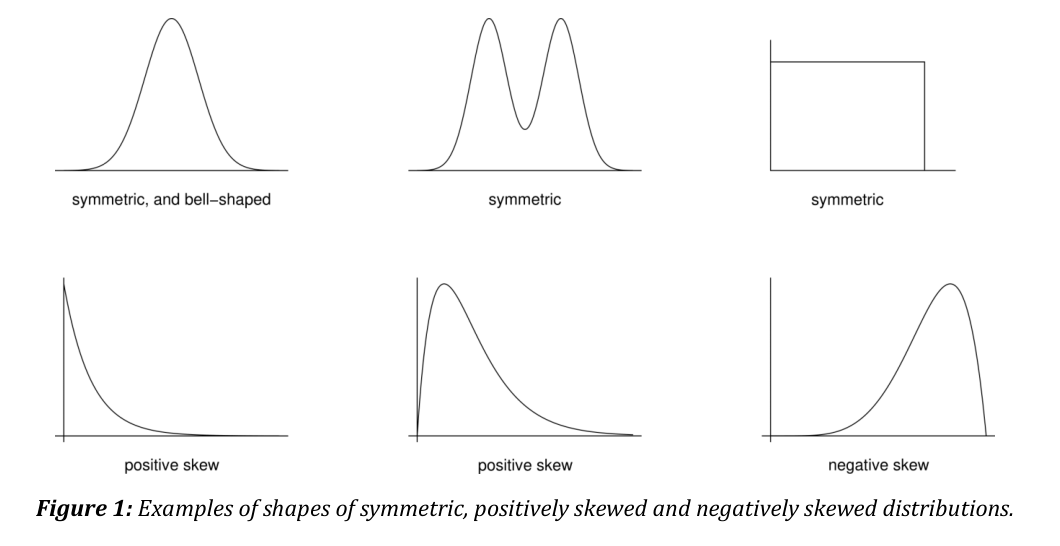
What is positive skew?
A distribution with a long tail extending to the right.

What is negative skew?
A distribution with a long tail extending to the left.

What is the five-number summary?
Minimum, lower quartile, median, upper quartile and maximum.
What does the median represent?
The middle value in the ordered data. For numerical data, use the middle observation when n is odd and the average of the middle two when n is even. For ordinal data, averaging category labels may make no sense.
What are the lower and upper quartiles?
The lower quartile (qL) separates approximately the lowest 25% of observations from the rest; the upper quartile (qU) separates approximately the highest 25% from the rest.
How is the range calculated?
Maximum - minimum.
How is the interquartile range (IQR) calculated?
Upper quartile - lower quartile: qU - qL.
What are the range and IQR measures of?
Spread or variability.
What is the sample mean?
The arithmetic average: x̄ = (1/n)Σxi.
What does the sample variance measure?
It measures spread in squared units. For n>1, s²=[Σᵢ(xᵢ−x̄)²]/(n−1), summing over the n observations.
What is the sample standard deviation?
The square root of sample variance; it has the data's original units.
When is median often preferred to mean?
When data are strongly skewed or contain outliers.
Why is the mean sensitive to outliers?
Extreme values directly affect the arithmetic average.
When is IQR often preferred to standard deviation?
For skewed data or data containing outliers.
What is the mode?
For categorical or discrete data, the mode is the value or values that occur most often. It is a measure of location.
Why should a sample mode for rounded continuous data be interpreted carefully?
Rounding or grouping can create repeated recorded values or change which value appears most often. The observed mode can therefore reflect measurement precision.
When do ratios and percentage changes make sense?
Only when the variable is measured on a ratio scale.
Why can percentage temperature changes be misleading in Celsius?
0°C is arbitrary, so Celsius is an interval rather than ratio scale.
Why do numerical category labels remain categorical data?
They label the categories. The numbers chosen carry no numerical meaning in themselves, so ordinary arithmetic on the labels need not be meaningful.
What is grouped data, and what information does grouping lose?
Grouped data report the number of observations in each class rather than each individual value. The exact values and their positions within a class cannot be recovered from those counts alone.
What is the 100p% sample quantile using the STAT0002 method?
For 0<p<1, use x_(p(n+1)), where x_(i) is the ith smallest observation. Interpolate when the rank is between two observations and use the nearest endpoint when it is outside the available ranks.
How do you linearly interpolate a sample quantile between two ordered observations?
If i<p(n+1)<i+1, the quantile estimate is x₍ᵢ₎+[p(n+1)−i](x₍ᵢ₊₁₎−x₍ᵢ₎). For ordinal categories, numerical interpolation may be meaningless.
. For ordinal categories, numerical interpolation may be meaningless.</p>](https://assets.knowt.com/user-attachments/d91f3ce9-3492-496e-b091-d0dd299546d0.png)
What if the course quantile position p(n+1) falls outside the available ranks?
Use the nearest observation: x₍₁₎ when the position is below 1 and x₍ₙ₎ when it is above n. An estimate further outside would require an extrapolation assumption.
What rank positions define the course’s sample quartiles?
For ordered data, use p=1/4, 1/2 and 3/4 for the lower quartile, median and upper quartile, respectively. The rank position is p(n+1), with linear interpolation when needed. This is the type-6 convention.
What is the difference between xᵢ and x₍ᵢ₎?
xᵢ is the observation in the original ith position. x₍ᵢ₎ is the ith smallest value after sorting, so x₍₁₎ is the minimum and x₍ₙ₎ is the maximum.
Is comparing the mean and median a reliable test for skewness?
No. Mean and median can give a misleading indication of skewness.

What should you primarily use to judge the shape or skewness of data?
A suitable plot of the distribution.
How does standardised sample skewness react to extreme values?
It is sensitive to very large or very small observations.
How does quartile skewness react to extreme values?
It is much less sensitive because it is based on quartiles.
Can different measures of skewness disagree?
Yes. They can disagree with each other and with the appearance of a plot.
Why must you consider what numerical data represent before summarising them?
The measurement scale and context determine which summaries are meaningful.
Why can the ordinary mean misrepresent circular measurements?
Directions wrap around, so values numerically far apart can be close on a circle. A meaningful summary must respect that geometry and the units of the data.

What is a frequency distribution?
A table showing how many observations fall into each of several non-overlapping classes.

What is the modal class?
The class or interval with the highest frequency.

How is relative frequency calculated?
Frequency of a class divided by the total number of observations (n).
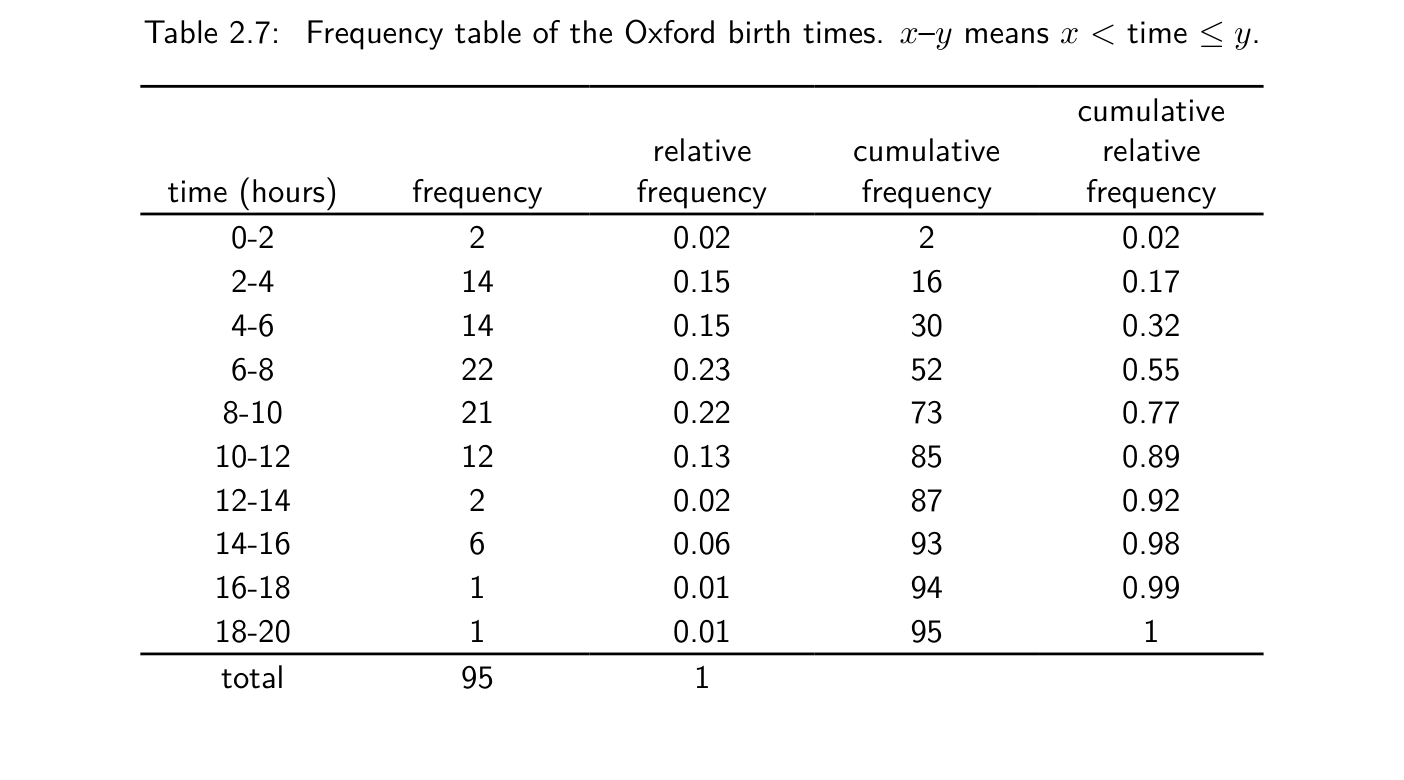
What is cumulative frequency?
The running total of frequencies up to and including a class.

What is cumulative relative frequency?
Cumulative frequency divided by n; the proportion of observations up to a class boundary.

What does the area of a histogram bar represent?
The relative frequency in that interval. In a normalised histogram, all bar areas sum to 1.
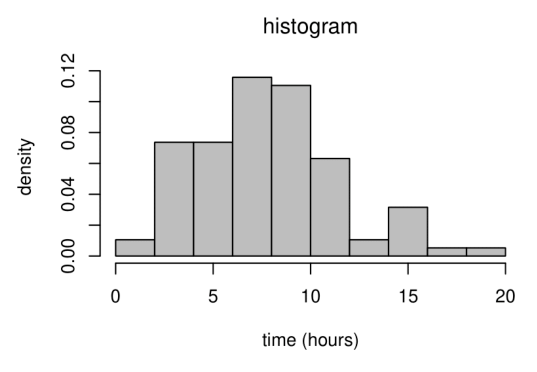
What is the height of a normalised histogram bar?
Relative frequency ÷ bin width = frequency ÷ (n × bin width).
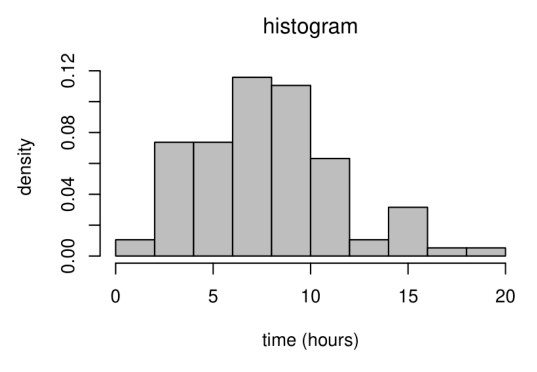
Why must histogram bin widths be accounted for?
With unequal widths, frequency alone gives misleading bar heights; area must reflect the amount of data.

What distinguishes a barplot from a histogram?
A barplot displays categorical or discrete numerical data with separated bars; a histogram displays binned continuous numerical data.

Are outliers necessarily incorrect observations?
No. Extreme values can arise naturally; do not automatically remove them.
What are boxplots especially useful for?
Comparing distributions’ location, spread and shape; their main purpose is not outlier detection.

Why are pie charts often ineffective?
Angles and areas are hard to compare accurately, and many categories create clutter.

What do the box and central line in a boxplot represent?
The box runs from the lower to the upper quartile and shows the middle 50% of the data. The line in the box is the sample median.

When should a time-series plot be used?
To display change over time; put time on the horizontal axis to reveal trends, cycles and unusual changes.

What can exploratory data analysis reveal before a formal analysis?
Graphs, tables and summary statistics can reveal errors, unusual observations, distribution shapes and relationships. They help guide the choice of analysis and communicate what the data show.
What should a graph’s labels and legend tell the reader?
Identify what each axis and its units represent, and explain any symbols or groups. Use a caption or legend where needed so the graph can be understood without guessing.
What is the equivalent formula for the sample variance using sums of squares?
For n>1, s²=[Σᵢxᵢ²−n(x̄)²]/(n−1). Using divisor n instead of n−1 gives s²(1−1/n).
How does a positive affine change of units affect sample summaries?
If yᵢ=axᵢ+b with a>0, mean and median become a times the old value plus b. The range, IQR and standard deviation multiply by a; the variance multiplies by a². Both sample skewness measures are unchanged where defined.
What is the advantage of using log(x/y) to compare two positive values?
log(x/y)=log x−log y. It is zero for equal values, and reversing the comparison changes its sign: log(y/x)=−log(x/y).
What does one unit on a log10 scale mean?
A tenfold change on the original scale; 10, 100 and 1,000 are equally spaced on a log10 axis.

What does a scatterplot show?
The relationship between two paired numerical variables, with each point representing one pair of observations.

Which variables normally go on the x-axis and y-axis of a scatterplot?
x: explanatory or predictor variable; y: response or outcome variable.

What four features should you examine in a scatterplot?
Direction, form (linear or curved), strength of association and unusual points/outliers.

Why can an outlier appear in a scatterplot but not in separate one-variable plots?
A point may have ordinary individual values but an unusual combination of the two variables.

Why might we transform a dataset?
To make a distribution more symmetric or a relationship more linear so a simple statistical method’s assumptions fit better.

How can a logarithmic transformation affect positively skewed data?
It compresses large positive values relative to small ones, often reducing right skew.

Which transformations might reduce positive skew?
For positive data, try a power with 0<c<1 (such as a square root), a log, or the monotone Box–Cox form with c<0. These can compress the long right tail; replot to check.

Which transformations might reduce negative skew?
For positive data, try powers y^c with c > 1, such as y² or y³, to stretch the upper tail.
When is taking logarithms directly invalid?
When observations are zero or negative; a suitable positive shift may sometimes be applied first.
Why might we straighten a curved scatterplot?
An approximately linear relationship is easier to interpret and better suited to methods such as linear regression.

Can you transform x, y or both to straighten a scatterplot?
Yes. Transform the explanatory variable, response variable or both, then inspect the new plot.

How do you recognise positive or negative association on a scatterplot?
Positive association: when one variable increases the other tends to increase. Negative association: when one increases the other tends to decrease. Either can be linear or curved.
What does Spearman's rank correlation coefficient measure?
How close the relationship is to being monotone. Rank each variable separately, giving rank 1 to the largest, then calculate the product-moment correlation of the paired ranks. Both sets of ranks must have nonzero spread. Perfect increasing and decreasing order give rₛ=1 and rₛ=−1, respectively.
What is sample quartile skewness?
[(qU−m)−(m−qL)]/(qU−qL), where qL, m and qU are the sample quartiles. It is defined when qU>qL.
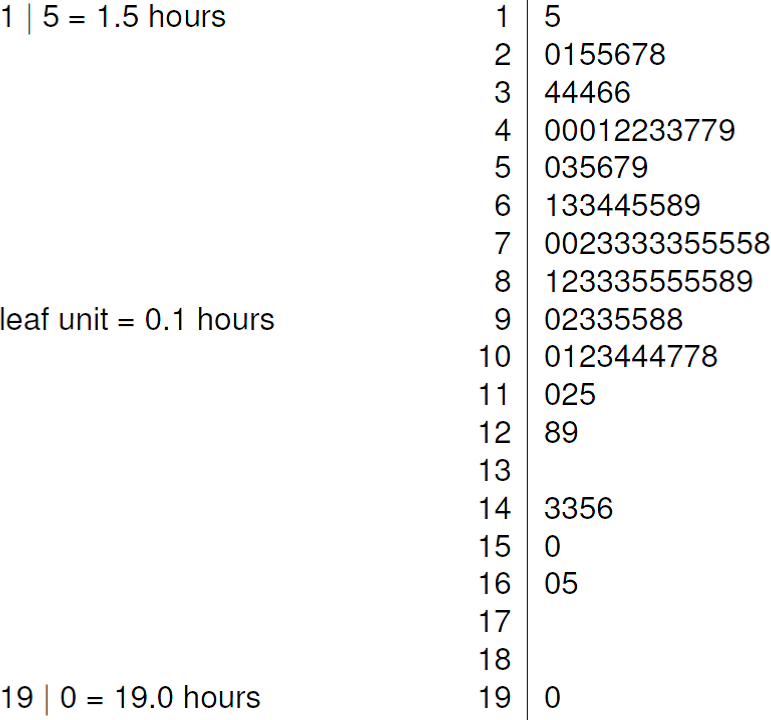
What is an advantage of a stem-and-leaf plot?
It preserves the entire dataset (perhaps rounded) in sorted order, making the five-number summary easy to calculate.
What is a dotplot?
Each observation is a dot; repeated values (perhaps after rounding) are stacked vertically.

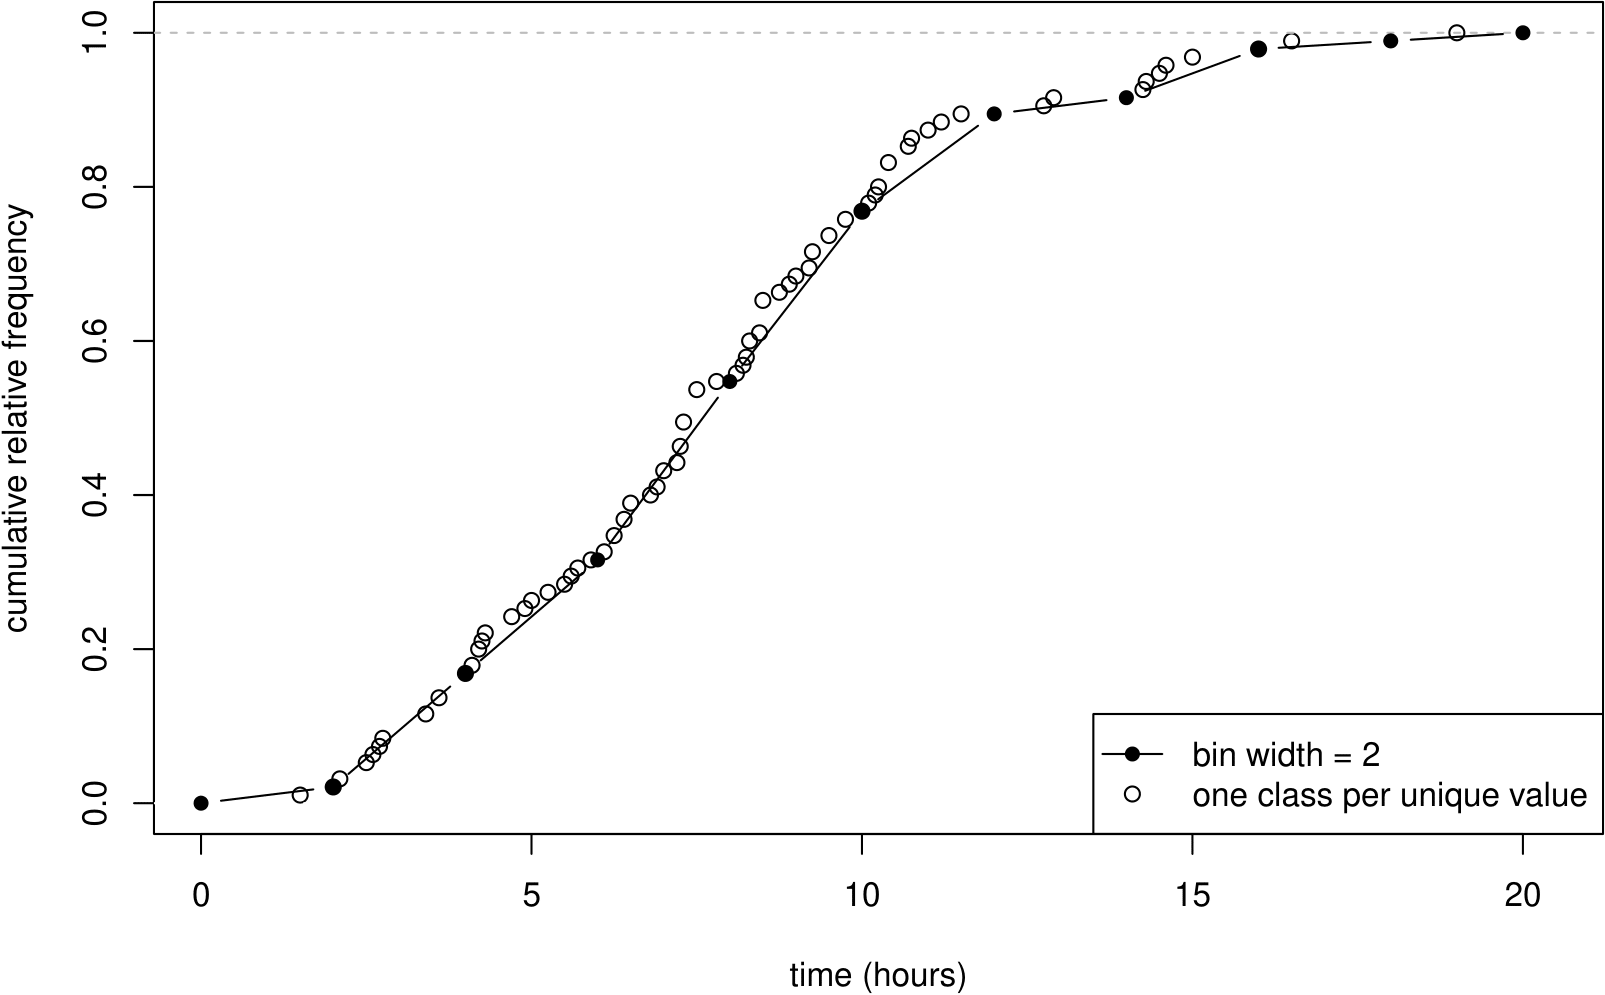
What is an empirical cumulative distribution function (ECDF)?
It gives the cumulative relative frequency: the proportion of observations less than or equal to each value.
What is Tukey and Mosteller's bulging rule?
A guide that uses the curve's bulging direction to suggest transformations of x, y or both that may straighten a scatterplot.

What is standardised sample skewness?
[(1/n)Σᵢ(xᵢ−x̄)³]/s³, where s is the sample standard deviation. This requires n>1 and s>0.
What values can the two sample skewness measures take?
Where defined, quartile skewness is in [−1,1]. Standardised sample skewness has no fixed bounds across sample sizes. Both are zero for perfectly symmetric data; the two signs can disagree.
How is Pearson’s sample correlation coefficient calculated?
For n≥2 paired observations whose two variables both vary, r=Σᵢ(xᵢ−x̄)(yᵢ−ȳ)/√[Σᵢ(xᵢ−x̄)²·Σᵢ(yᵢ−ȳ)²]. It measures linear association.
What directions of transformation does the bulging rule suggest?
Compare the curve with the straight line joining its ends. For a positive variable that bulges down, try a power below 1, such as a square root, or try a log. For a variable that bulges up, try a power above 1. Consider x and y separately.