Perspectives & Research: AP Psychology 24
 Call Kai
 Learn
Learn Practice Test
 Spaced Repetition
 Match
Match Flashcards
1/72

There's no tags or description
Looks like no tags are added yet.
Name | Mastery | Learn | Test | Matching | Spaced | Call with Kai | Chat |
|---|

73 Terms
Perspectives
current points of view and sets of assumptions that influence both what psychologists will study and how. Determines what to look for, where to look, and the methods to use. aka school of thought.
Empirical Evidence
Evidence that is carefully gathered through objective observations and carefully measured (think: use data to form conclusions)
Structuralism
Early school of thought; Uses INTROSPECTION and the brain's response to stimuli to discover the structure of the human mind.
Functionalism
An early school of thought that explored how mental and behavioral processes FUNCTION (work) - how they enable the organism to adapt, survive, and flourish
Behaviorism/Behavioral Perspective
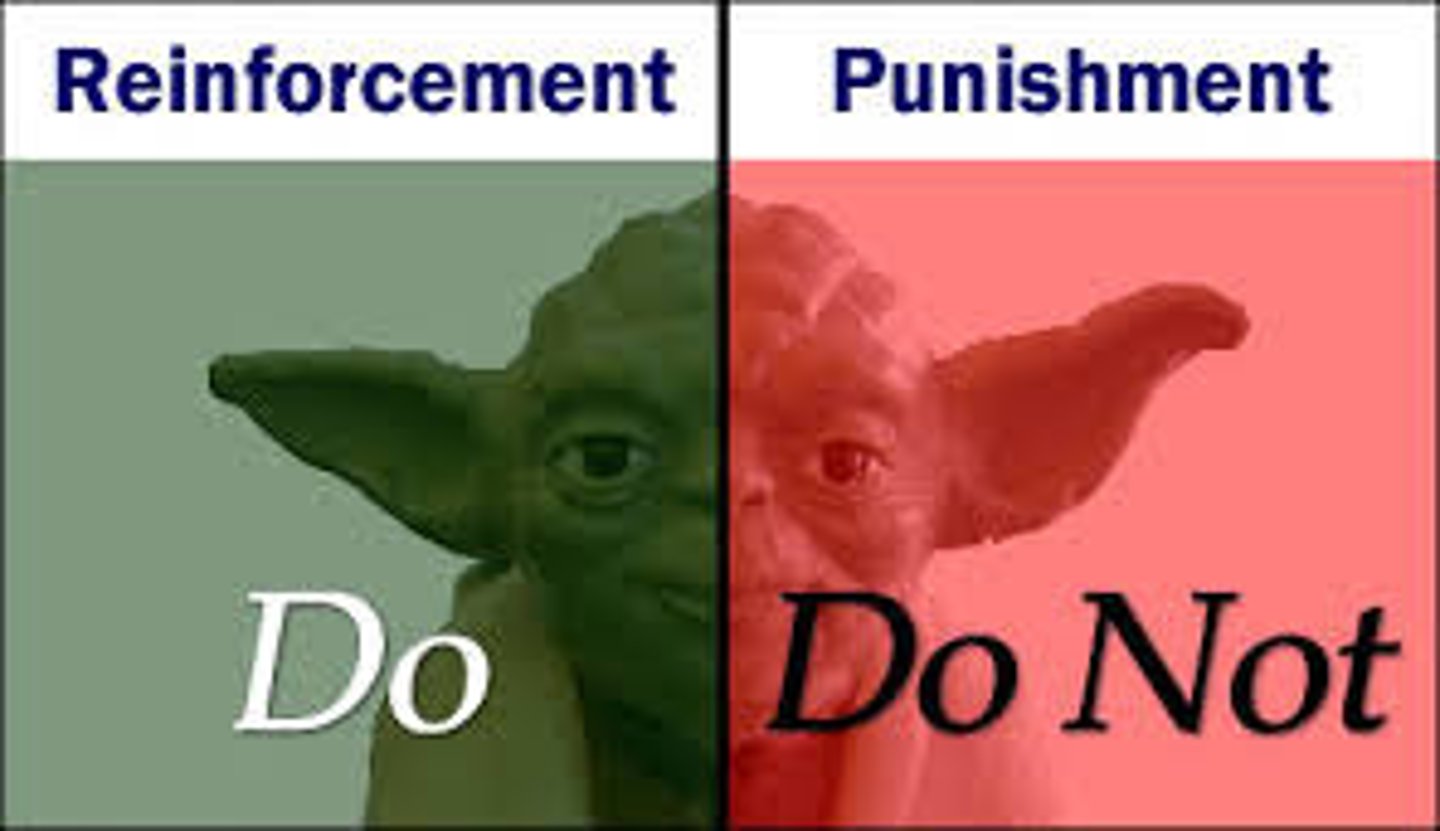
Focus on environmental factors that shape behavior. OBSERVABLE behaviors (not internal/thinking). These include antecedents that trigger a behavior or the consequences from rewards and punishment.
Cognitive Perspective
Study of the brain activity linked with processing information (including perception, thinking, memory, and language).

Psychology
The study using the scientific process, that looks at organisms' behavior.
Biological Perspective
Considers the natural selection of adaptive traits, genetic predisposition responding to environments, brain mechanisms, and hormone influences on behavior.
Social-cultural Perspective
Analyzes the presence of others, cultural, societal, and family expectations, peer and other group influences, and compelling models (including media) on behavior.
Evolutionary psychology
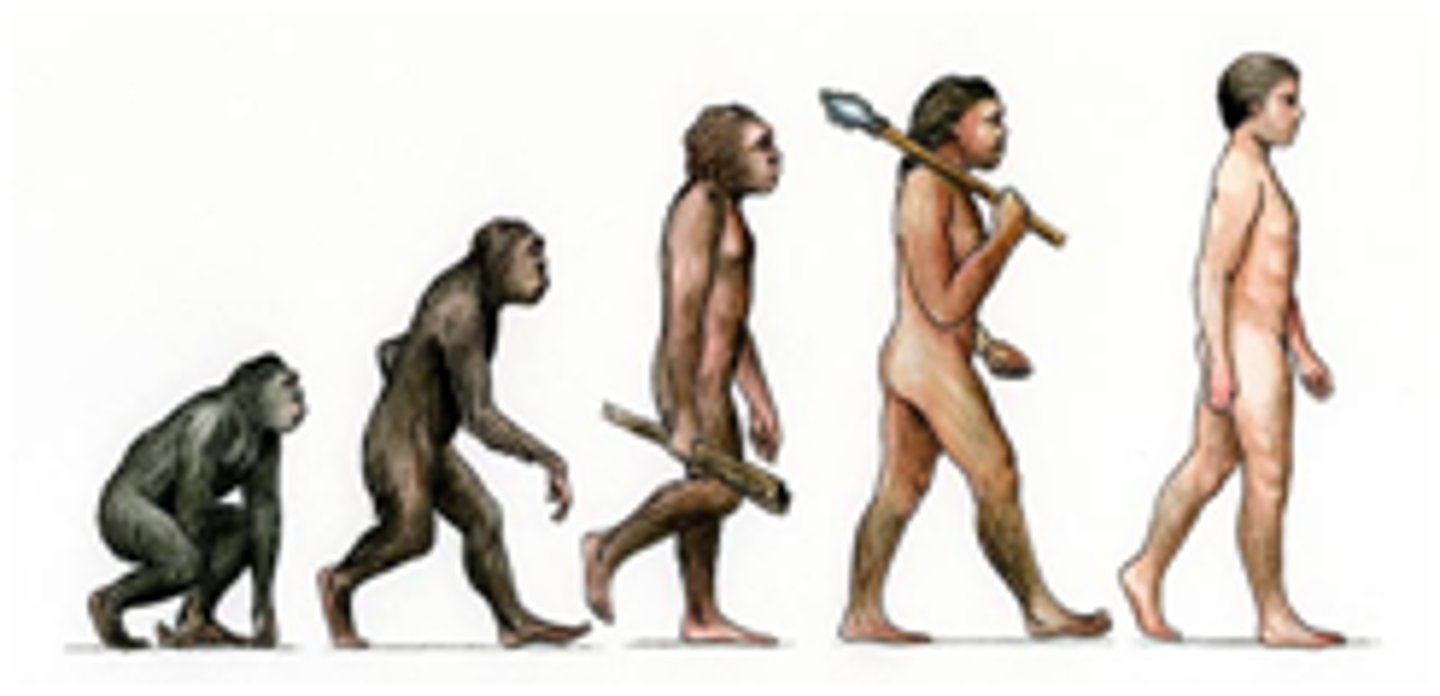
Examines trends/natural selection overtime in regards to traits, mental abilities, and their adaption from generation to generation through observation
Psychodynamic (Psychoanalytic) psychology
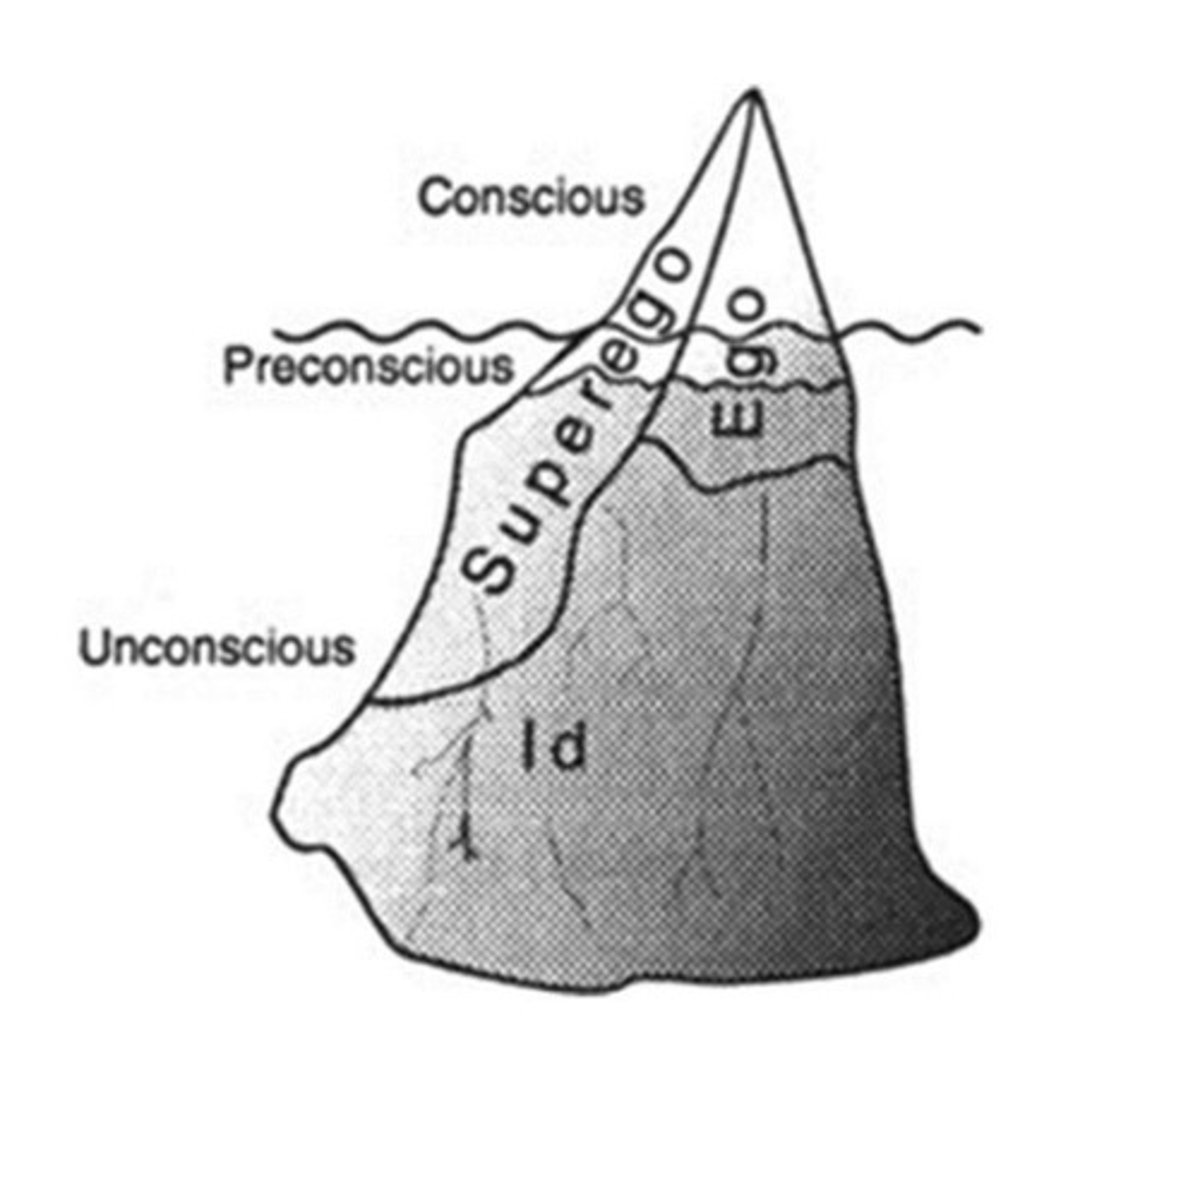
Founded by Freud that focuses on the unconscious and inner conflicts from early childhood experiences.
Humanistic Perspective
Purpose of behavior is to strive to be the best person of one's self by filling the void. Studies patterns in individual's history, integrating mind, body, and behavior, and social cultural forces. They do this by looking at happiness and satisfaction through self-reports(introspection) using talk therapy.
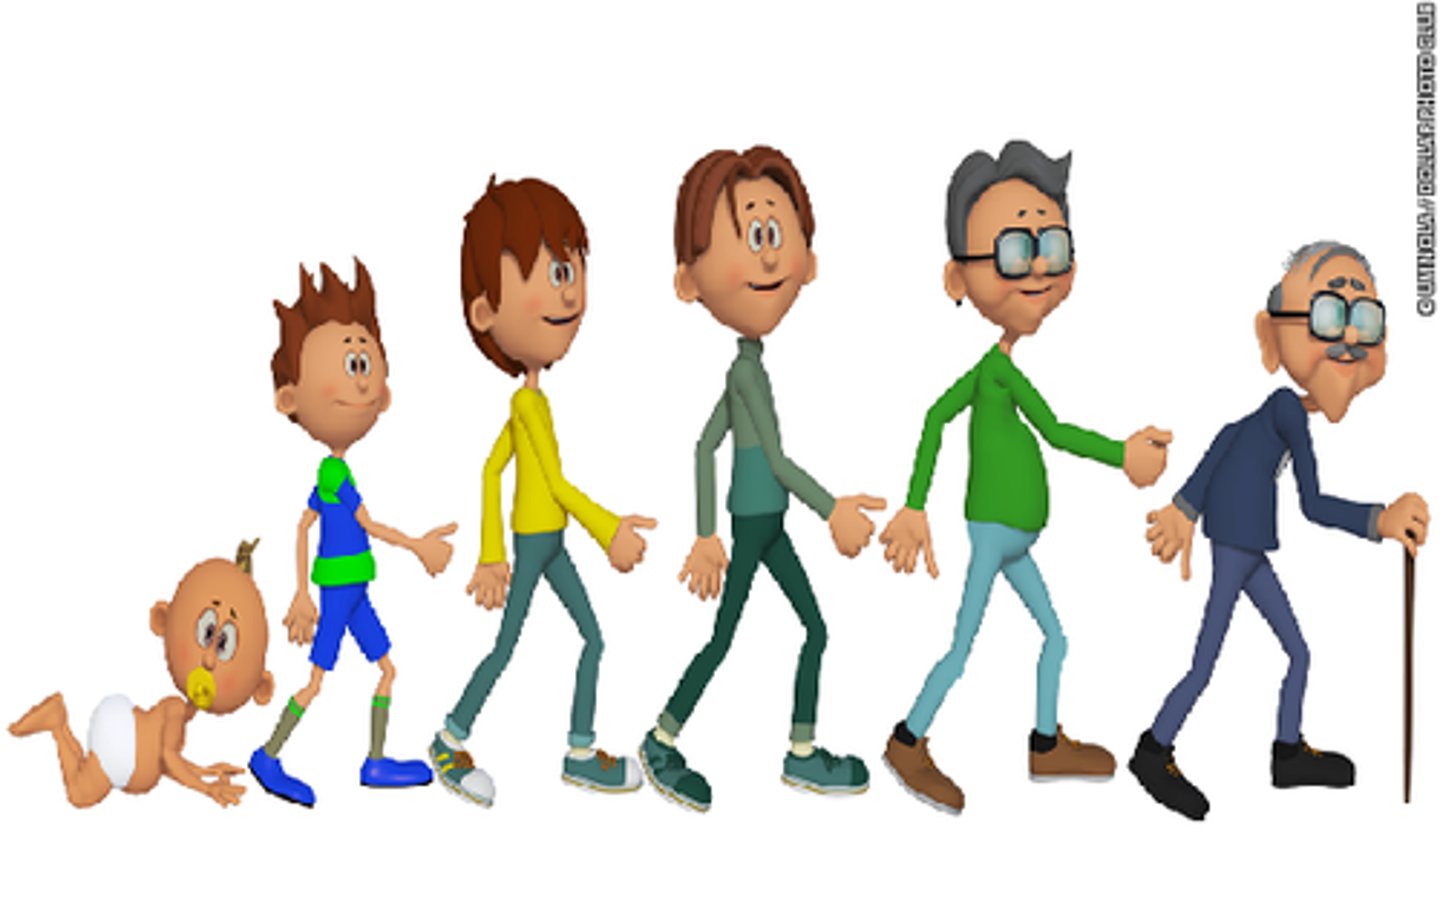
Developmental Psychology
A branch of psychology that studies physical, cognitive, and social change throughout the life span.
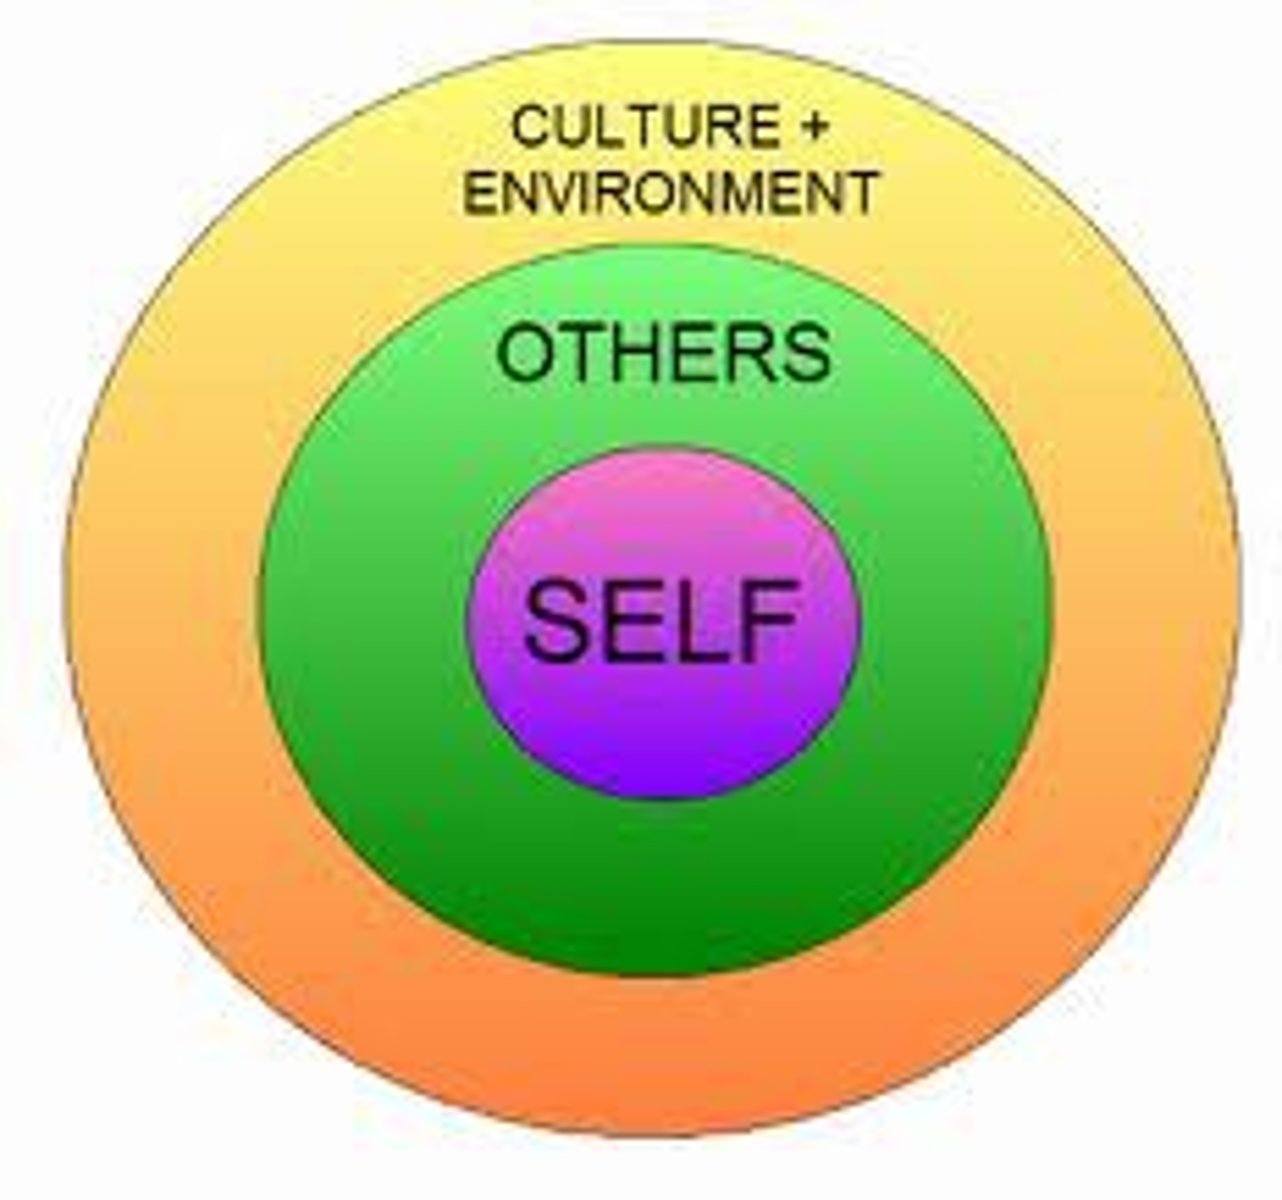
Social psychology
the scientific study of how we think about, influence, and relate to one another.
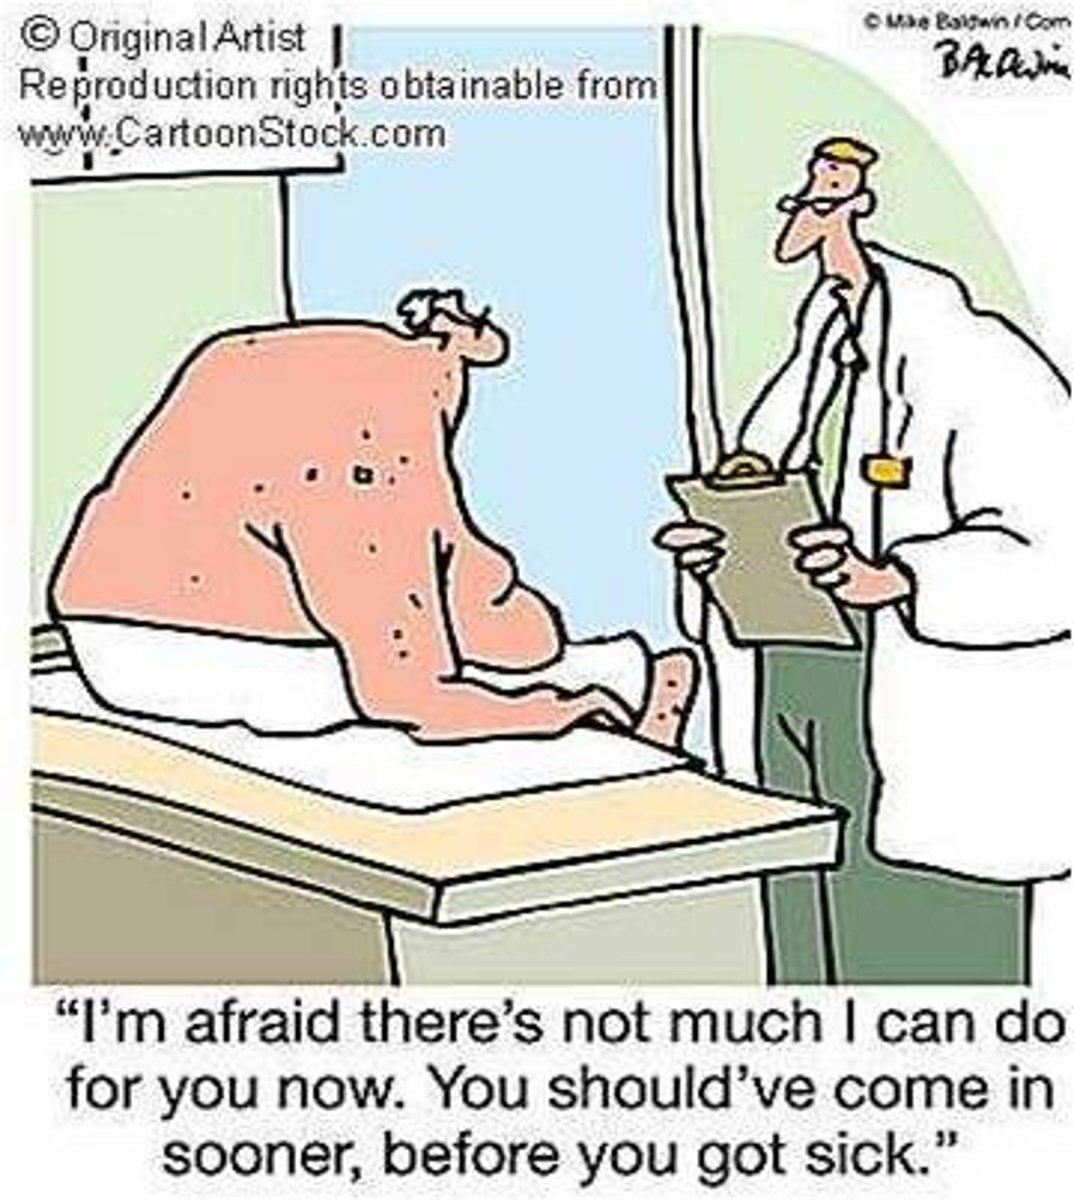
Hindsight Bias
The natural tendency to believe that, after seeing the outcome, one would have foreseen it. (knew it all along phenomenon)
Overconfidence
The natural tendency to think that we know more and are more efficient than we actually are.
Hypothesis
prediction of how two or more factors are likely to be related. If __(IV)___, then ___(DV)____.

Sample
the subgroup of the population that participates in the study
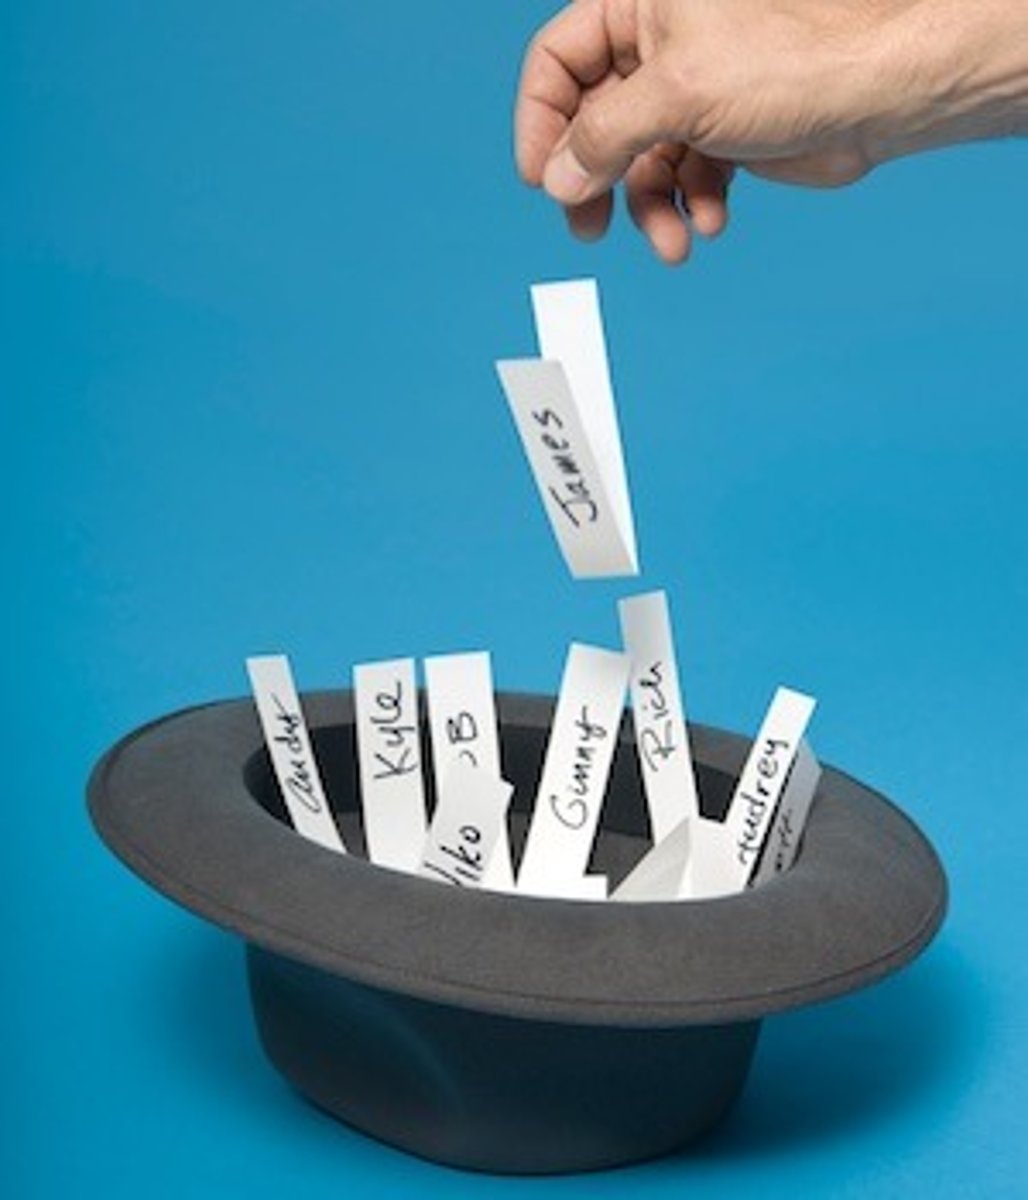
Random Selection
choosing of members of a population so that every individual has an equal chance of being chosen. Purpose is to have a representative sample.
Operational definition
A carefully worded statement of the exact procedures (operations) used in a research study. For example human intelligence can be operationally defined as what an intelligence test measures.

Replication
repeating the essence a of research study, usually with different participants in different situations, to see whether the basic findings extends to other participants and circumstances.
Case Study
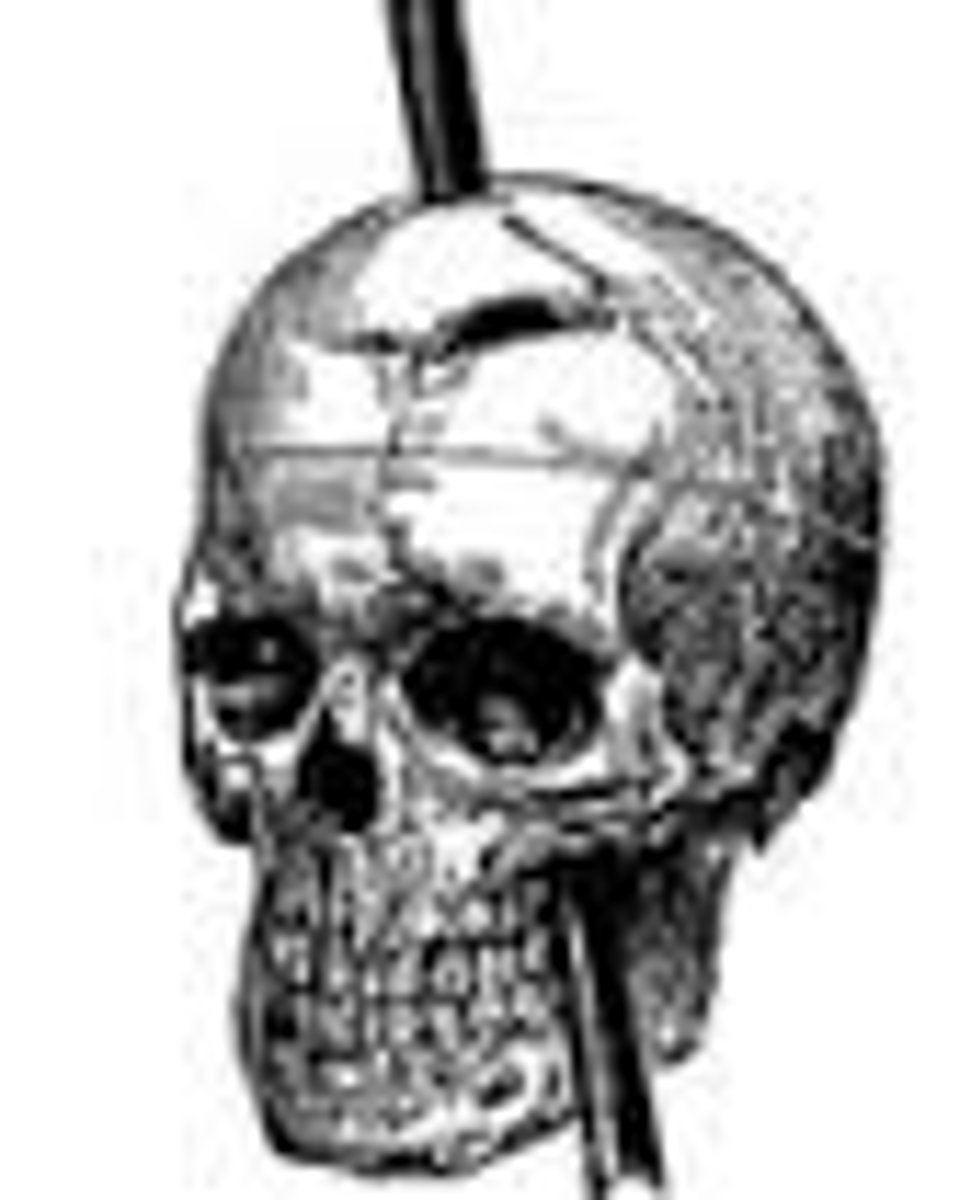
A study of one individual or group that had a bizarre and unusual situation that would be unethical to replicate. Phineas Gage is a famous example. Limited to only description (no causation).
Survey
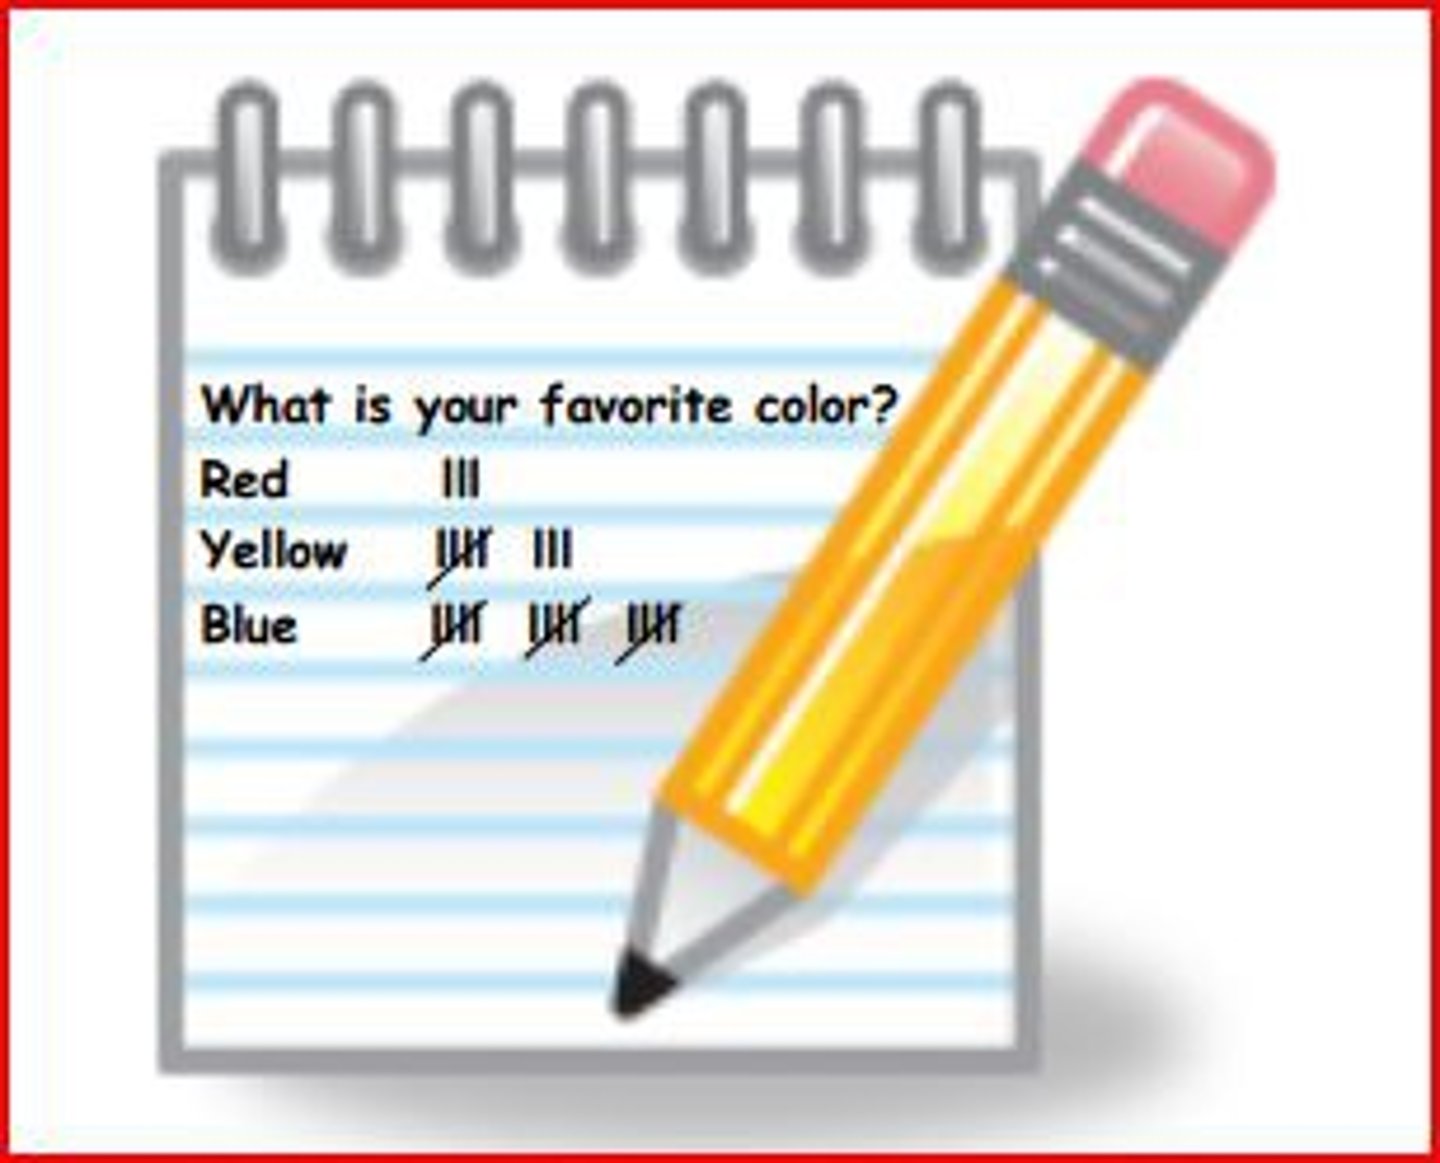
A study of a large group of people through the answering of constant questions either online or in person on paper. Strengths: it is cheap, fast, includes a large number of people, allows for generalizations to be made, and is anonymous. Weaknesses: It does not go in depth, has fixed responses, and it is hard to avoid volunteer bias.
Naturalistic observation
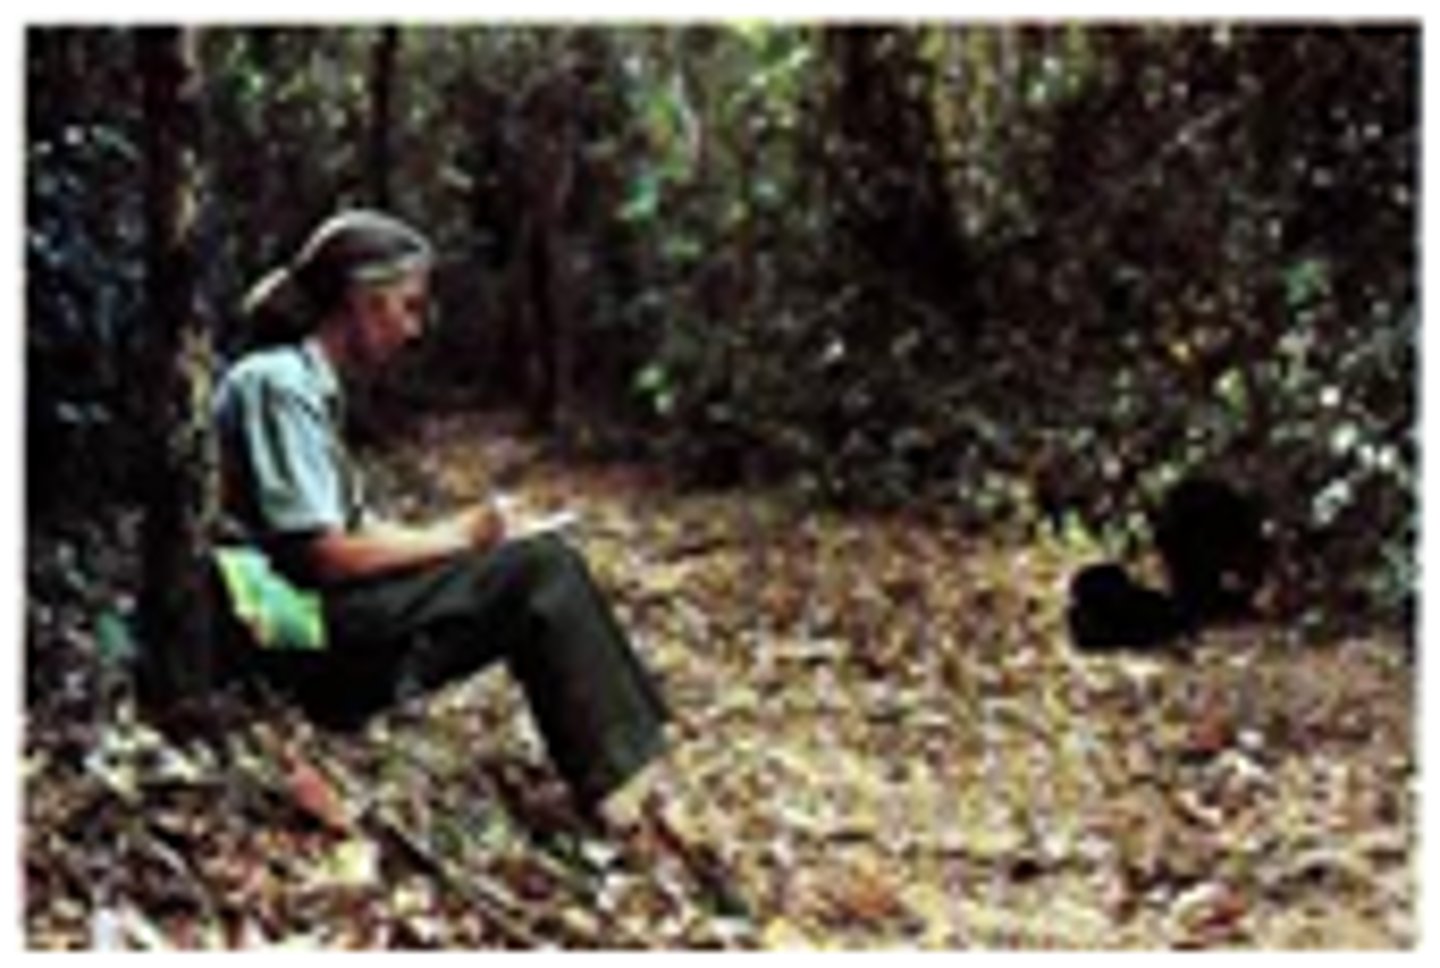
A study of a group or person in their "natural habitat" without disturbance or awareness that can alter their behavior. Strengths: it eliminates lying, is convenient, and generally not expensive. Weaknesses: forces assumptions to be made, is hard to measure, and there is no control.
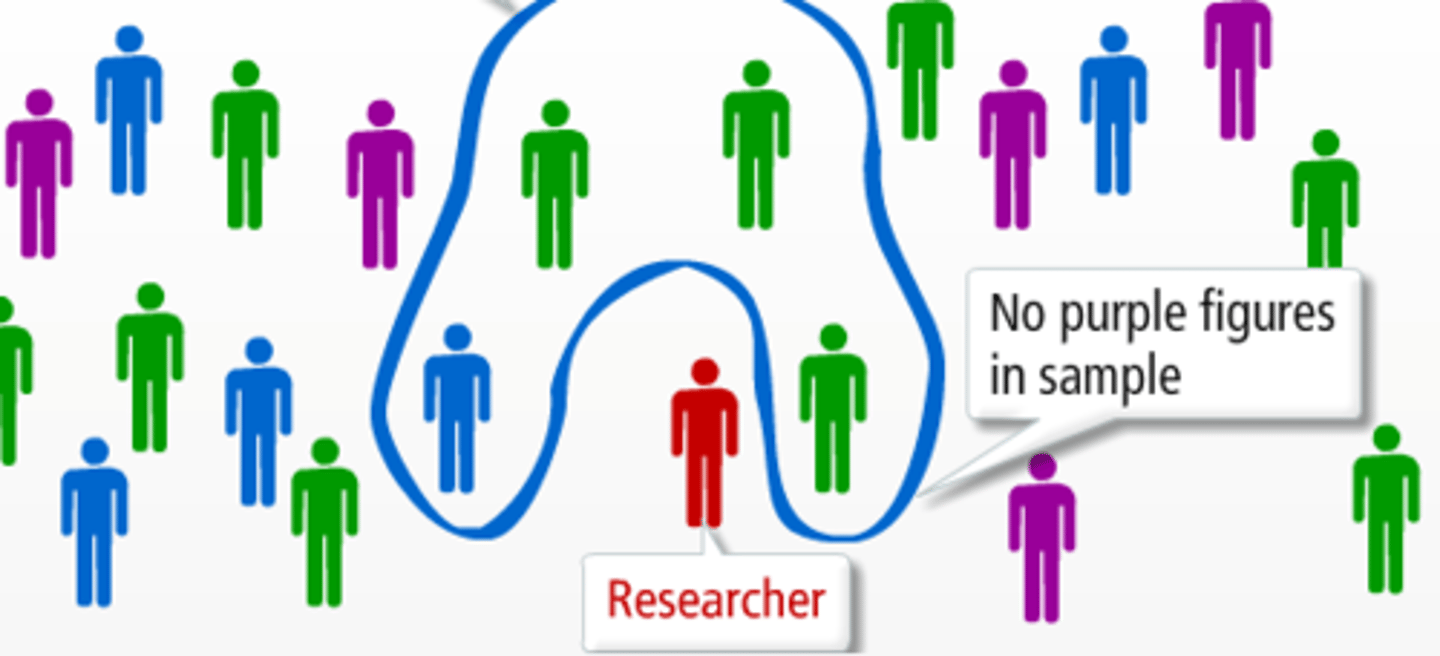
sampling bias
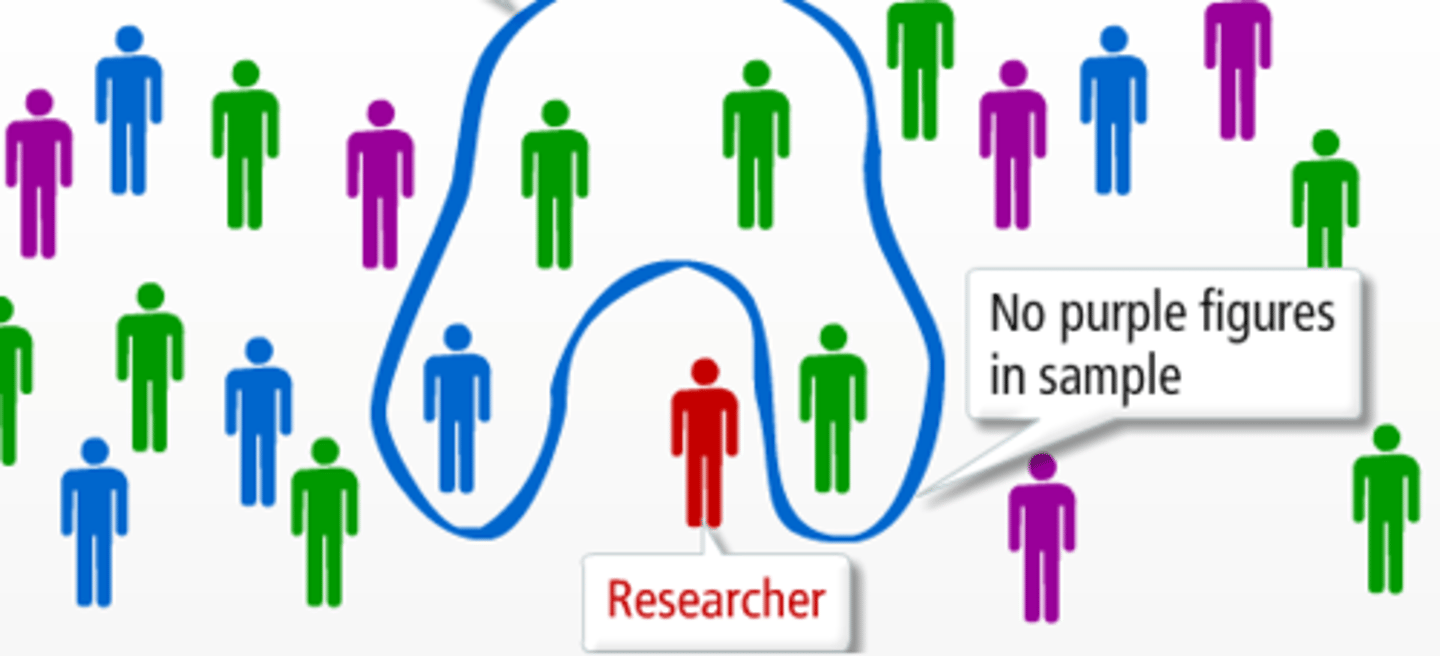
a flawed sampling process that produces an unrepresentative sample
Population
all those in a group being studied, from which samples may be drawn. (ALL potential subjects)
Random sample/selection
a sample that fairly represents a population because because each member has a equal chance of inclusion. This helps to balance extraneous variables.
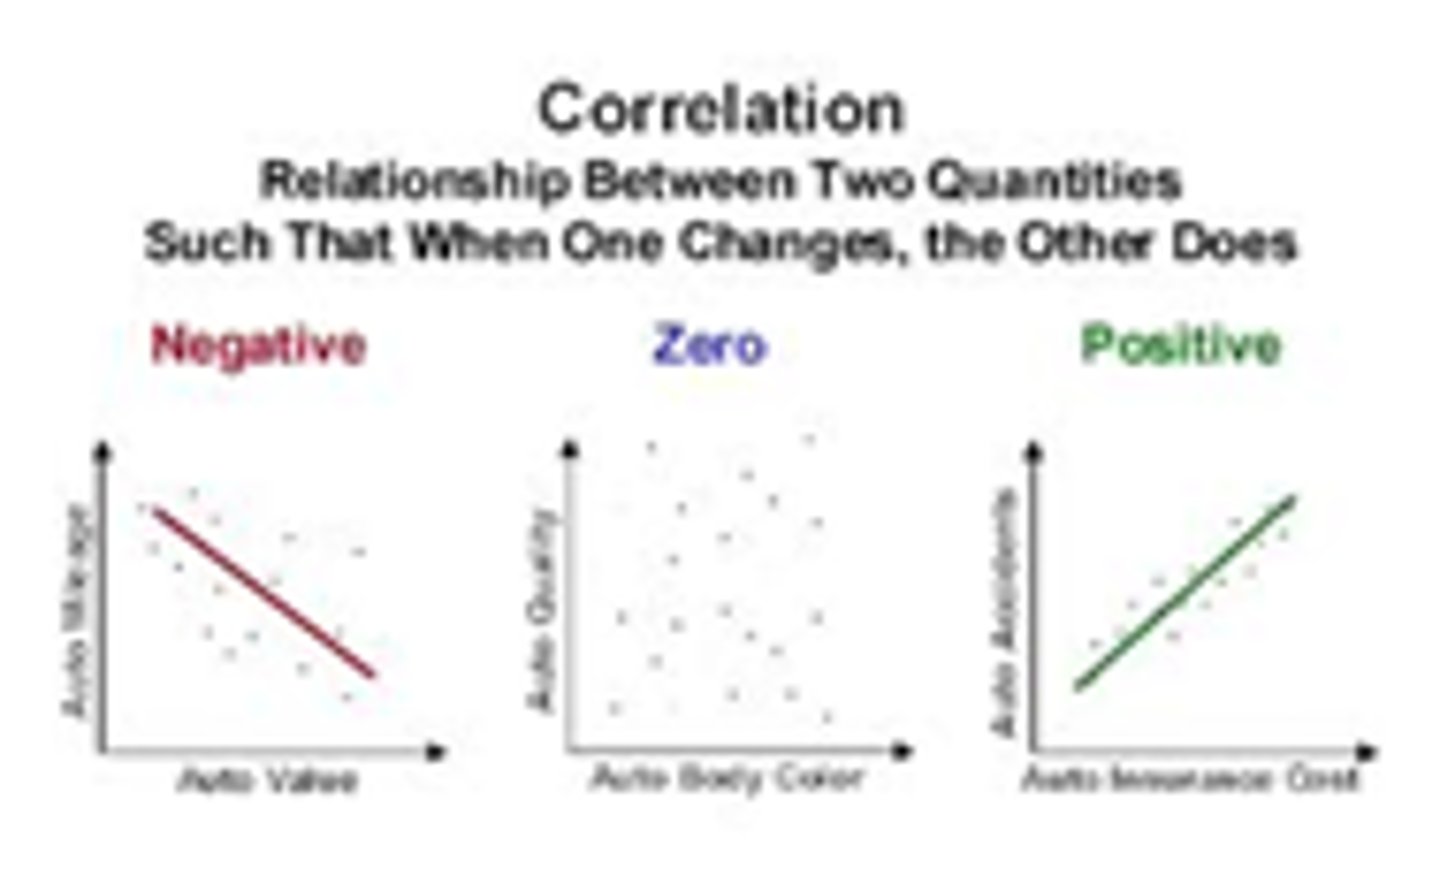
Correlation
To assess if and how one variable will predict another, or observe two variables' relationship. CORRELATION DOES NOT EQUAL CAUSATION.
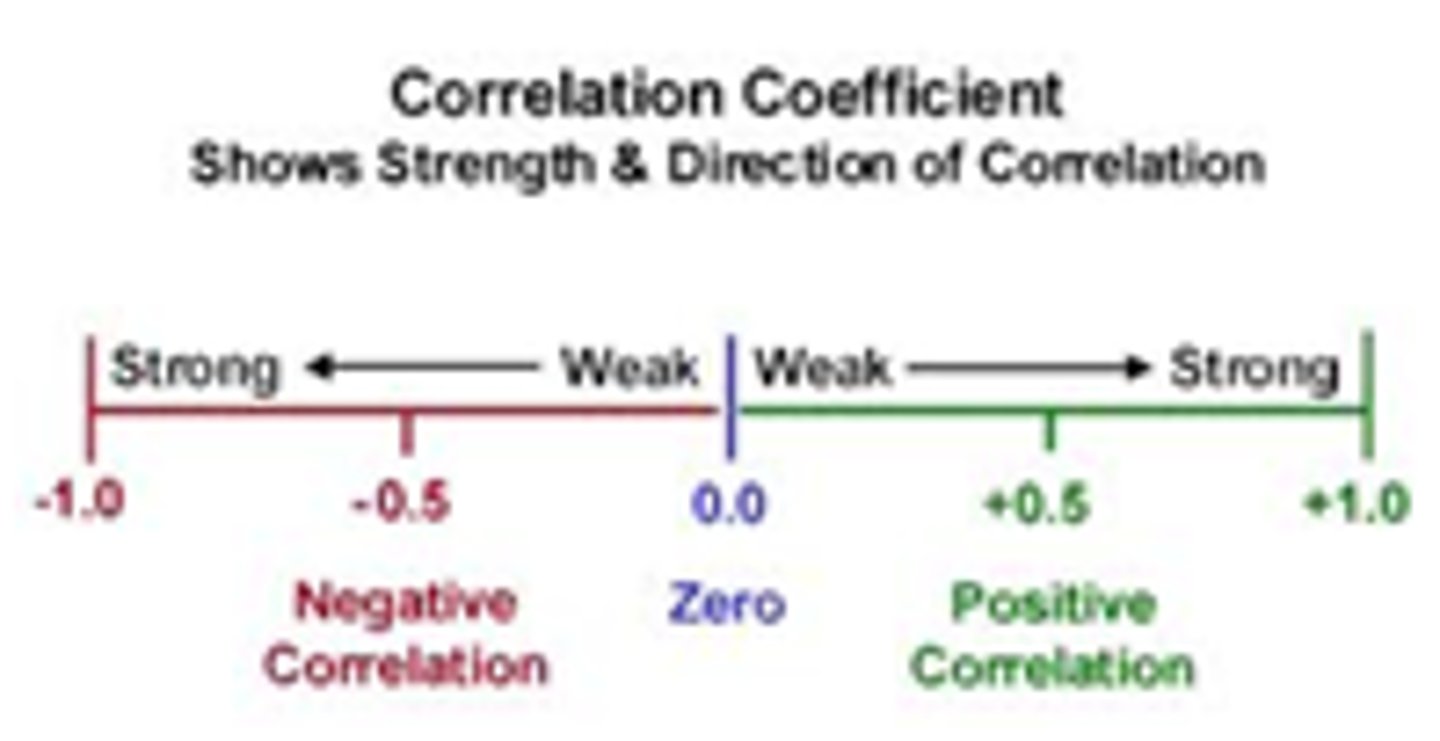
Correlation coefficient
The statistical measurement that reveals how closely two things vary together. +1 is a perfect positive correlation, -1 is a perfect negative correlation, and 0 indicated no correlation. 0-0.1 is no correlation, 0.1-0.3 is a weak correlation, 0.4-0.6 is a moderate correlation, and 0.7-1.0 is a strong correlation.
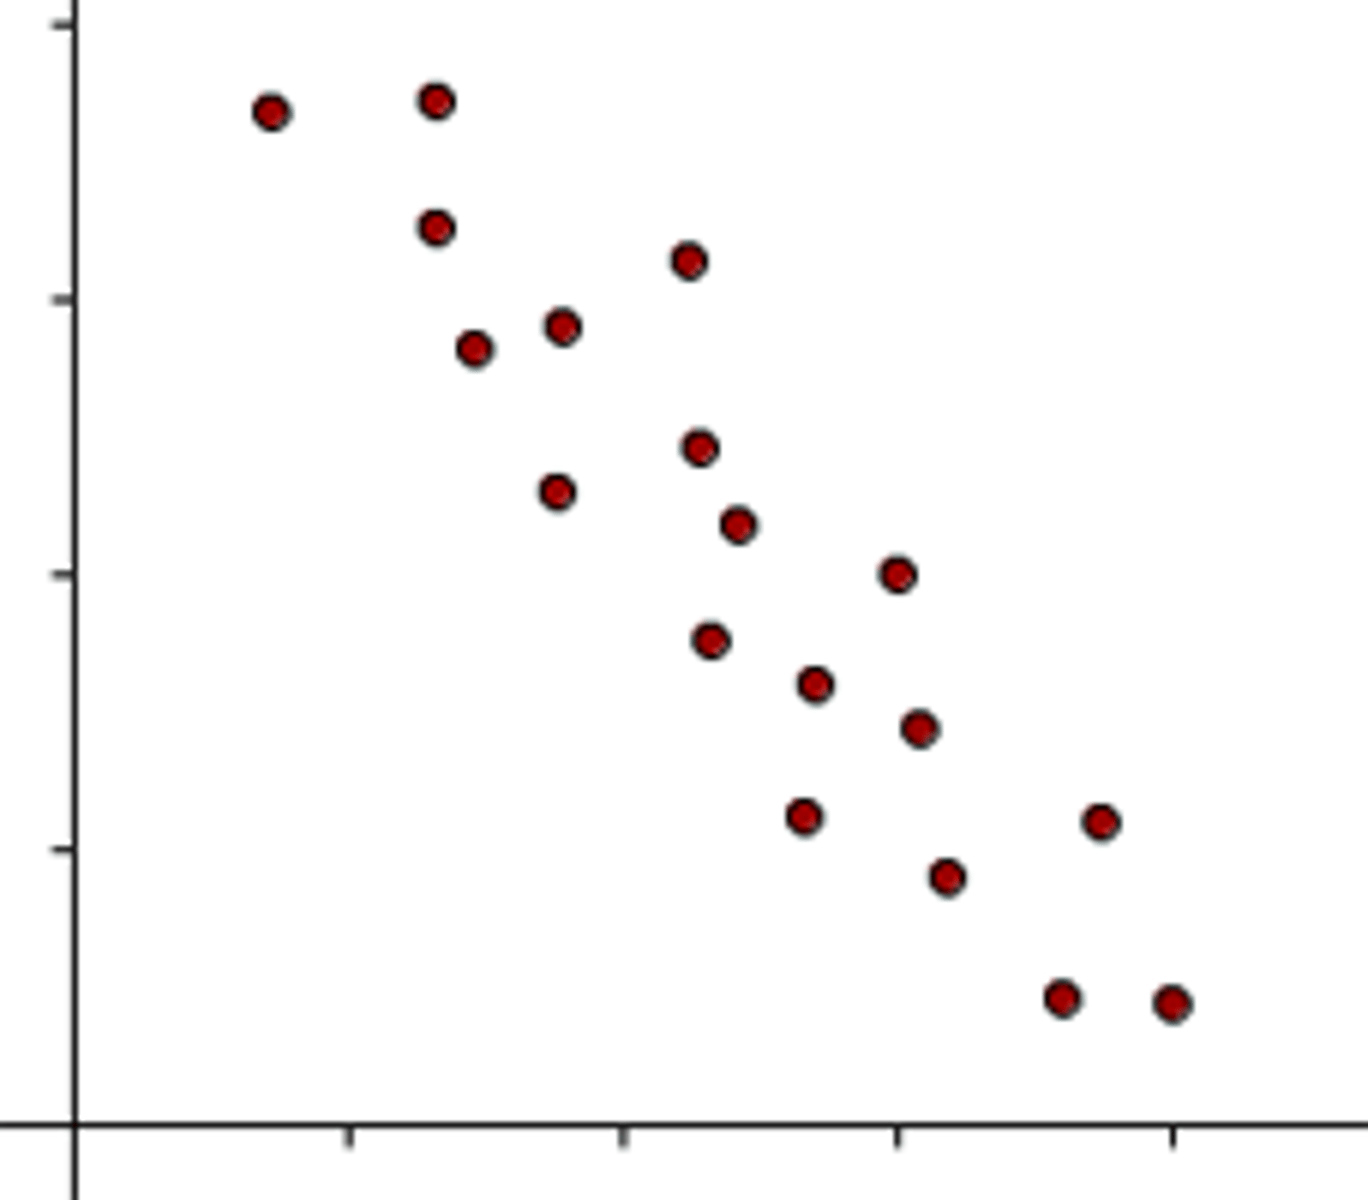
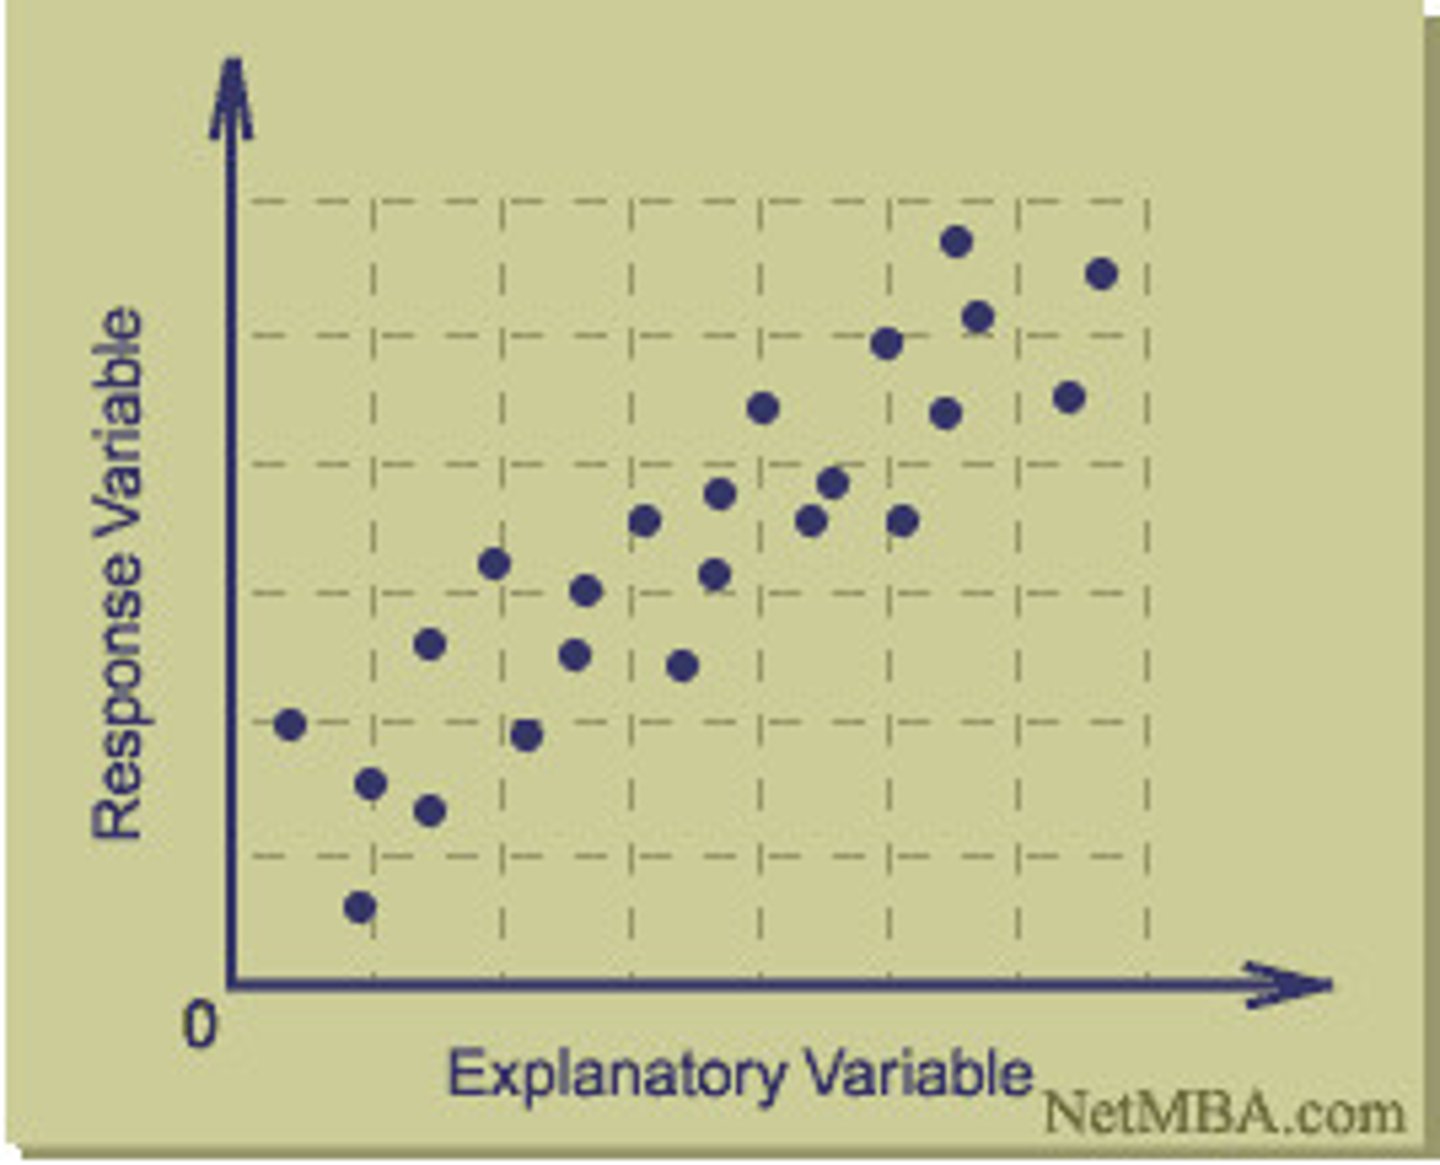
Scatterplot
Shows correlation by showing how closely negative or positive data trends.
Illusory correlation
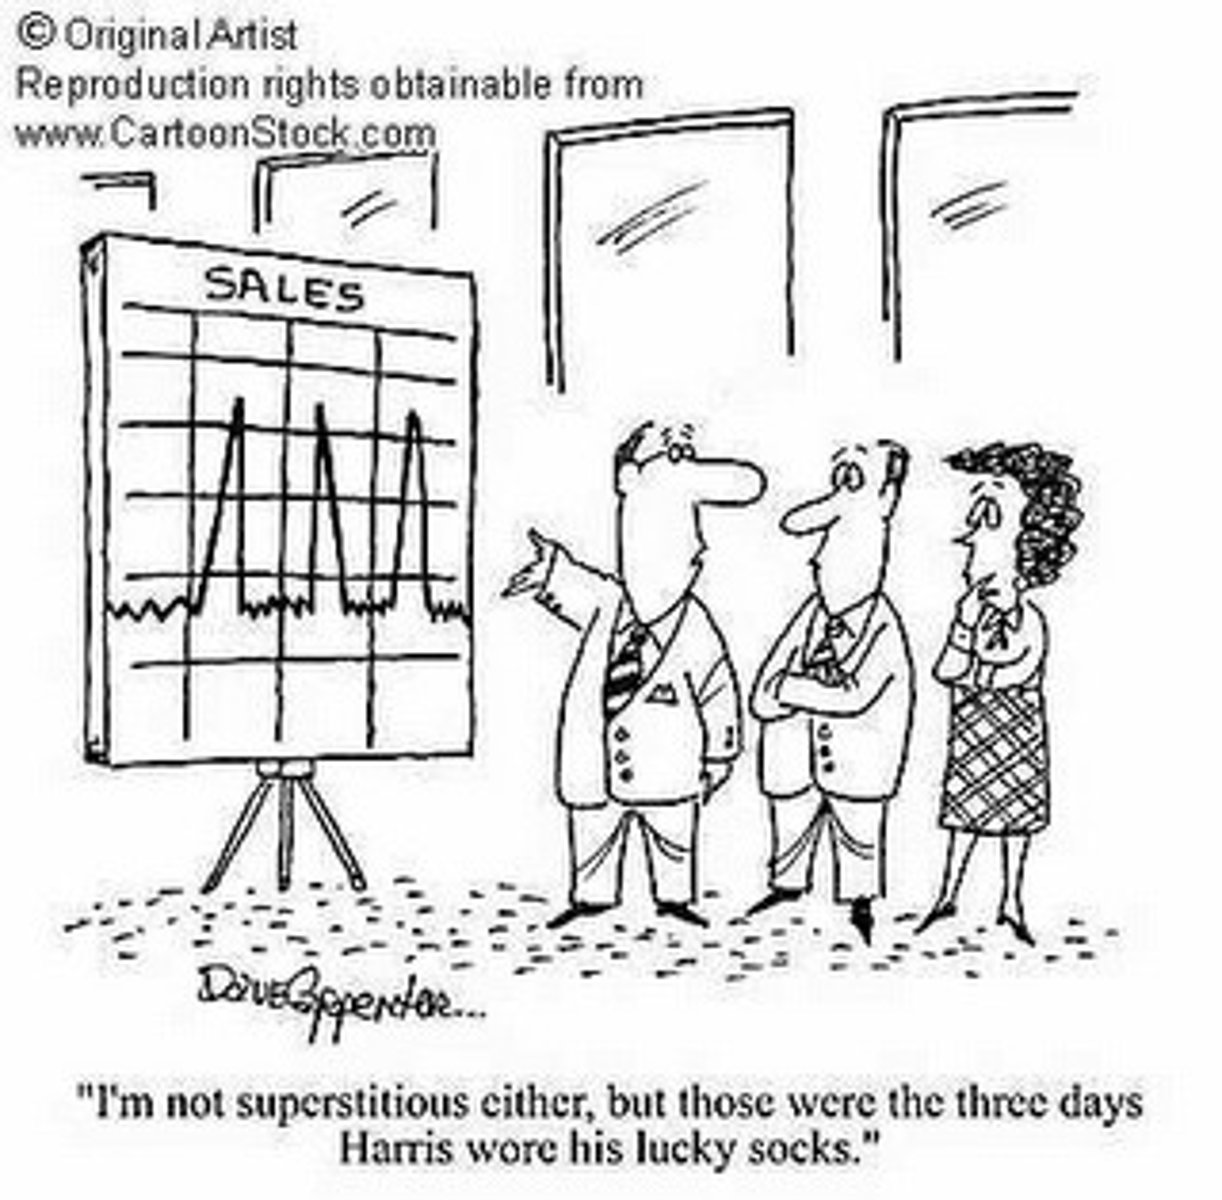
the tendency of people to see relationships where they don't exist. People see streaks and patterns in random data. Also, more bizarre events stand out against mundane ones leading to their remembrance and the idea of a correlation. (ex: superstition, stereotyping)
Experiment
Examines cause and effect by manipulating factor and observing isolated responses using experiments and random assignment. ONLY experiments can examine cause and effect. Follows the scientific method and isolates independent and dependent variables by eliminating confounding variables.
Random assignment
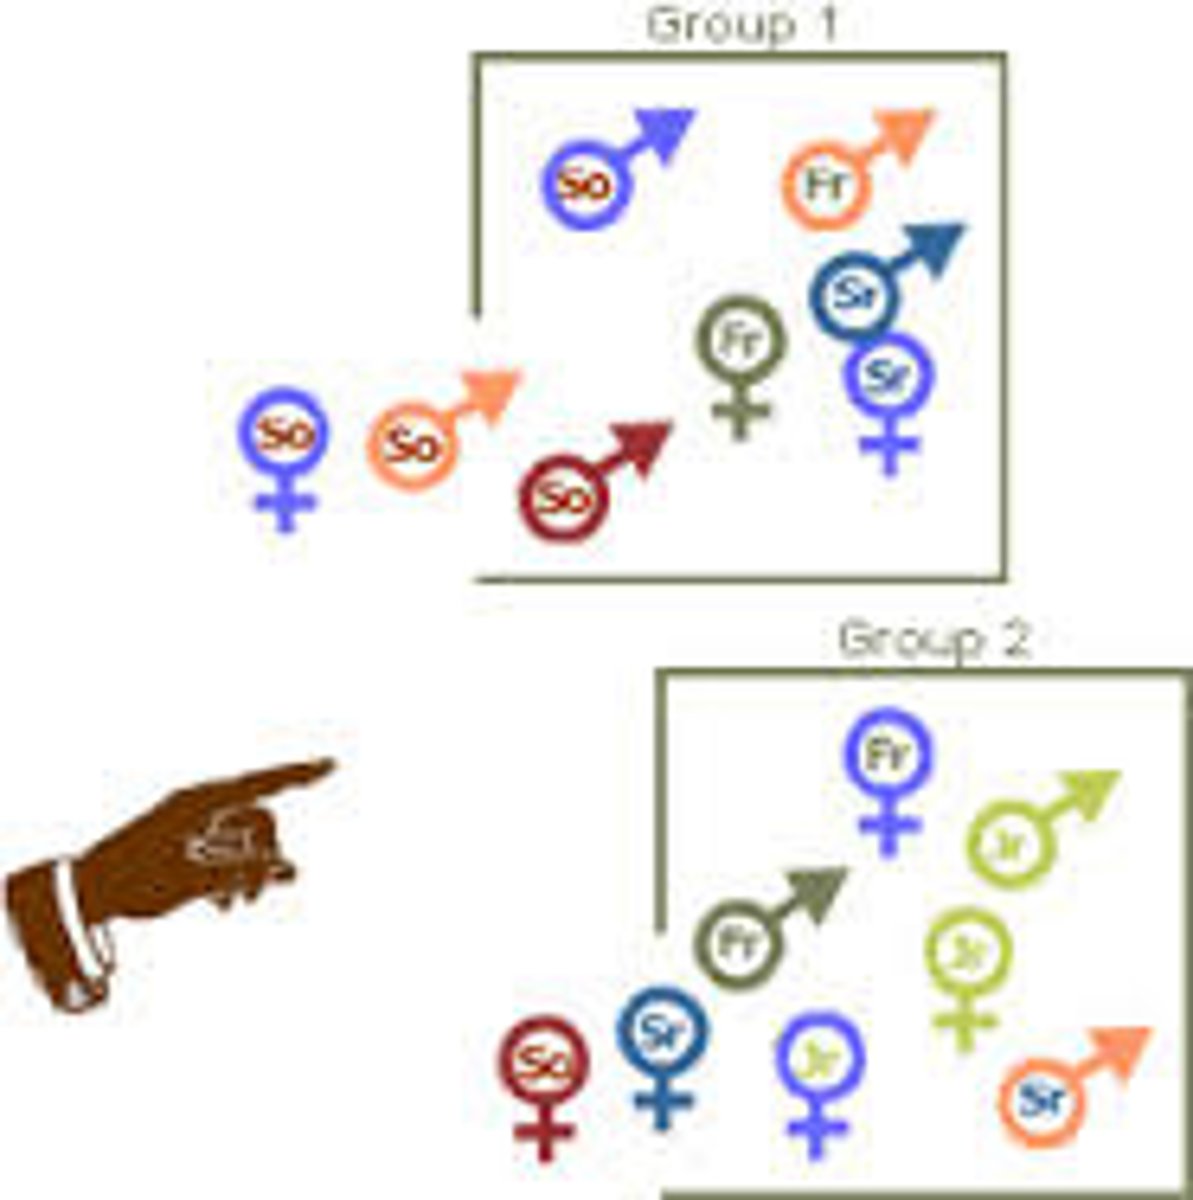
Assigning participants randomly to the experimental and control group to minimize preexisting differences between the groups.
Double-blind procedure
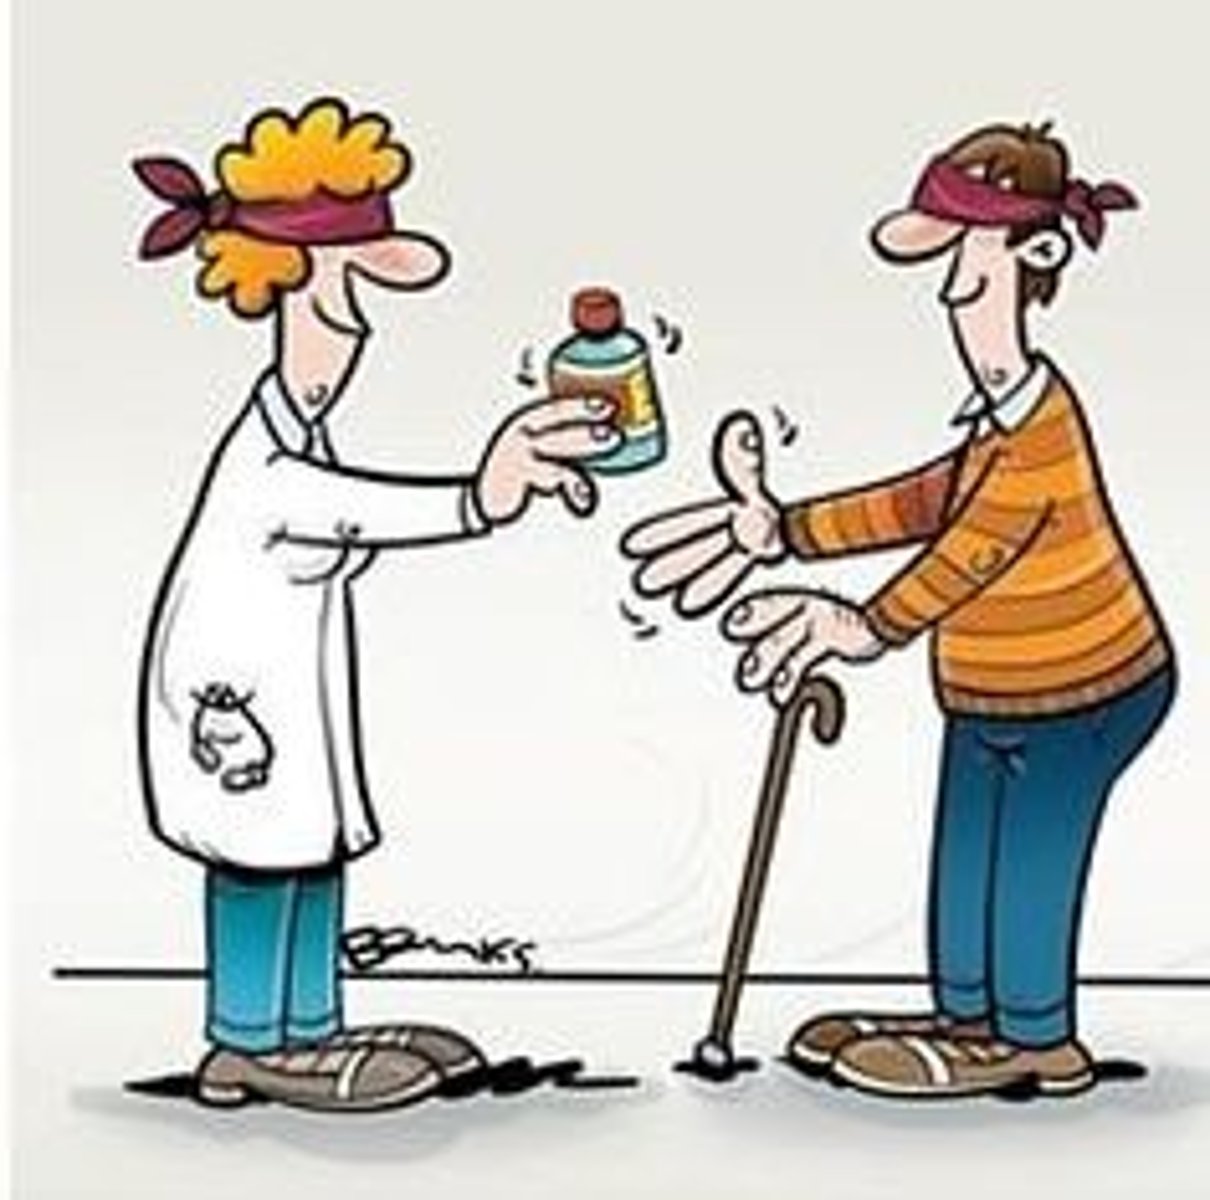
An experiment where neither the experimenter or the participants know which group they are in.
Placebo effect
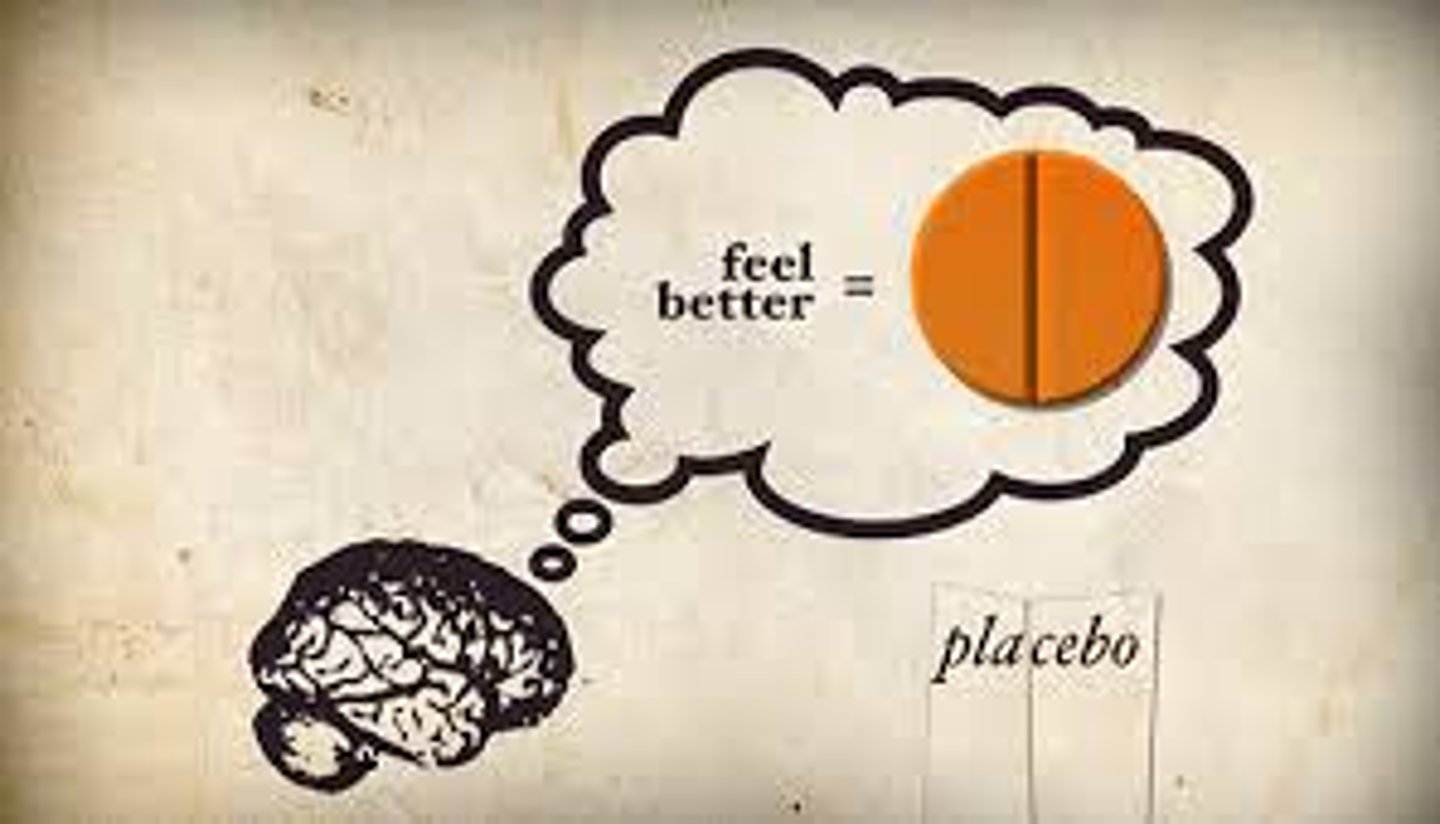
Experimental result caused by expectations alone; any effect on behavior caused by the administration of an inert substance or condition, which the recipient assumes is an active agent.
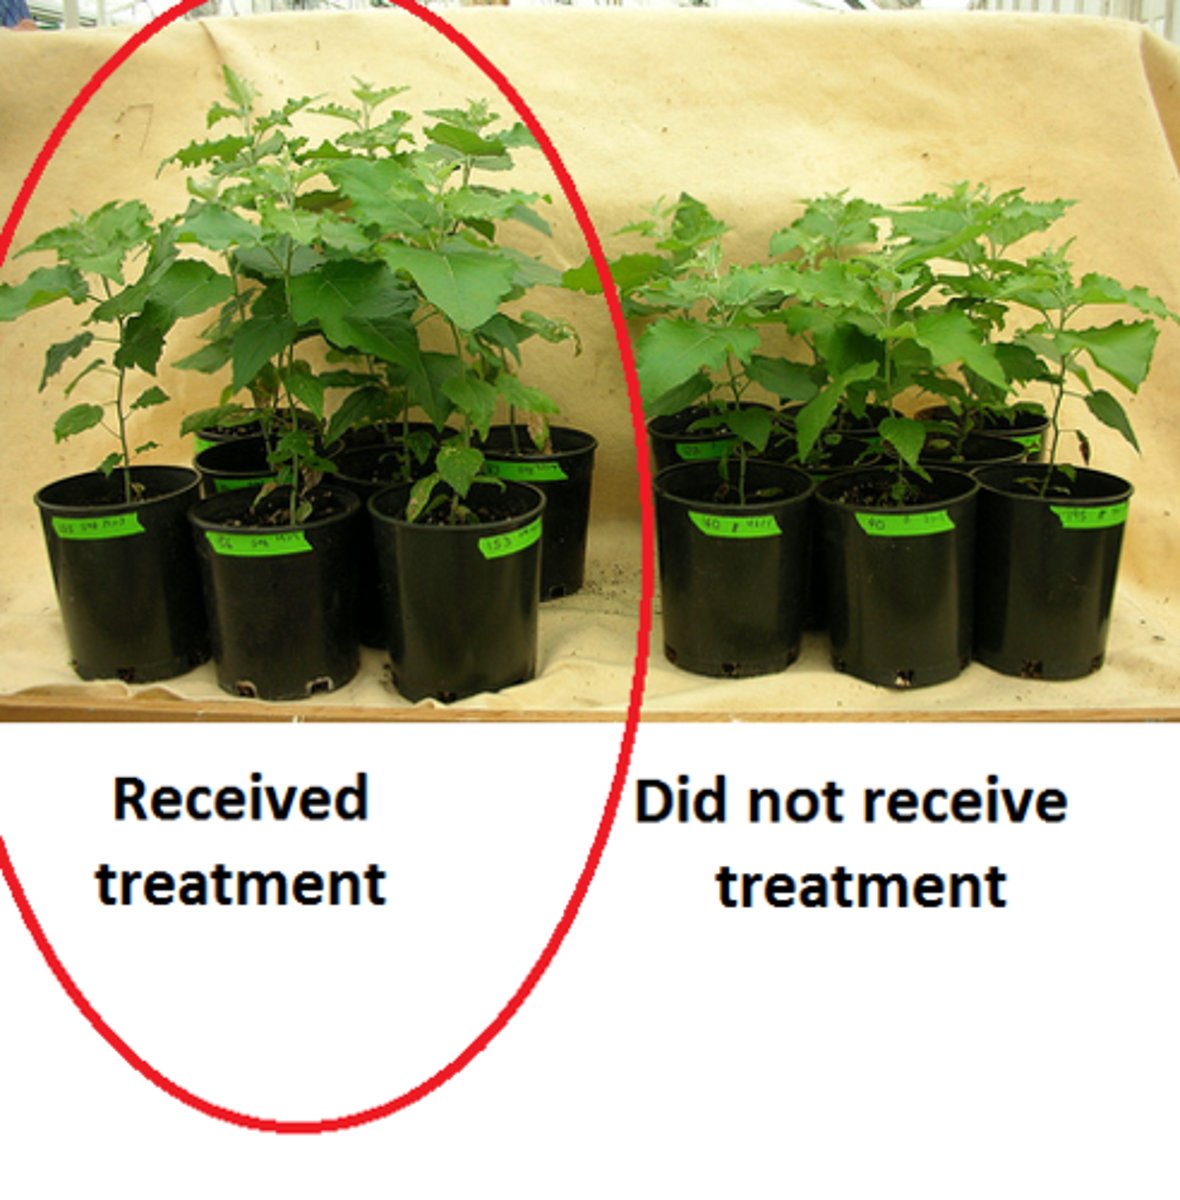
Experimental group
in an experiment, the group exposed to the treatment, that is, to one version of the independent variable.
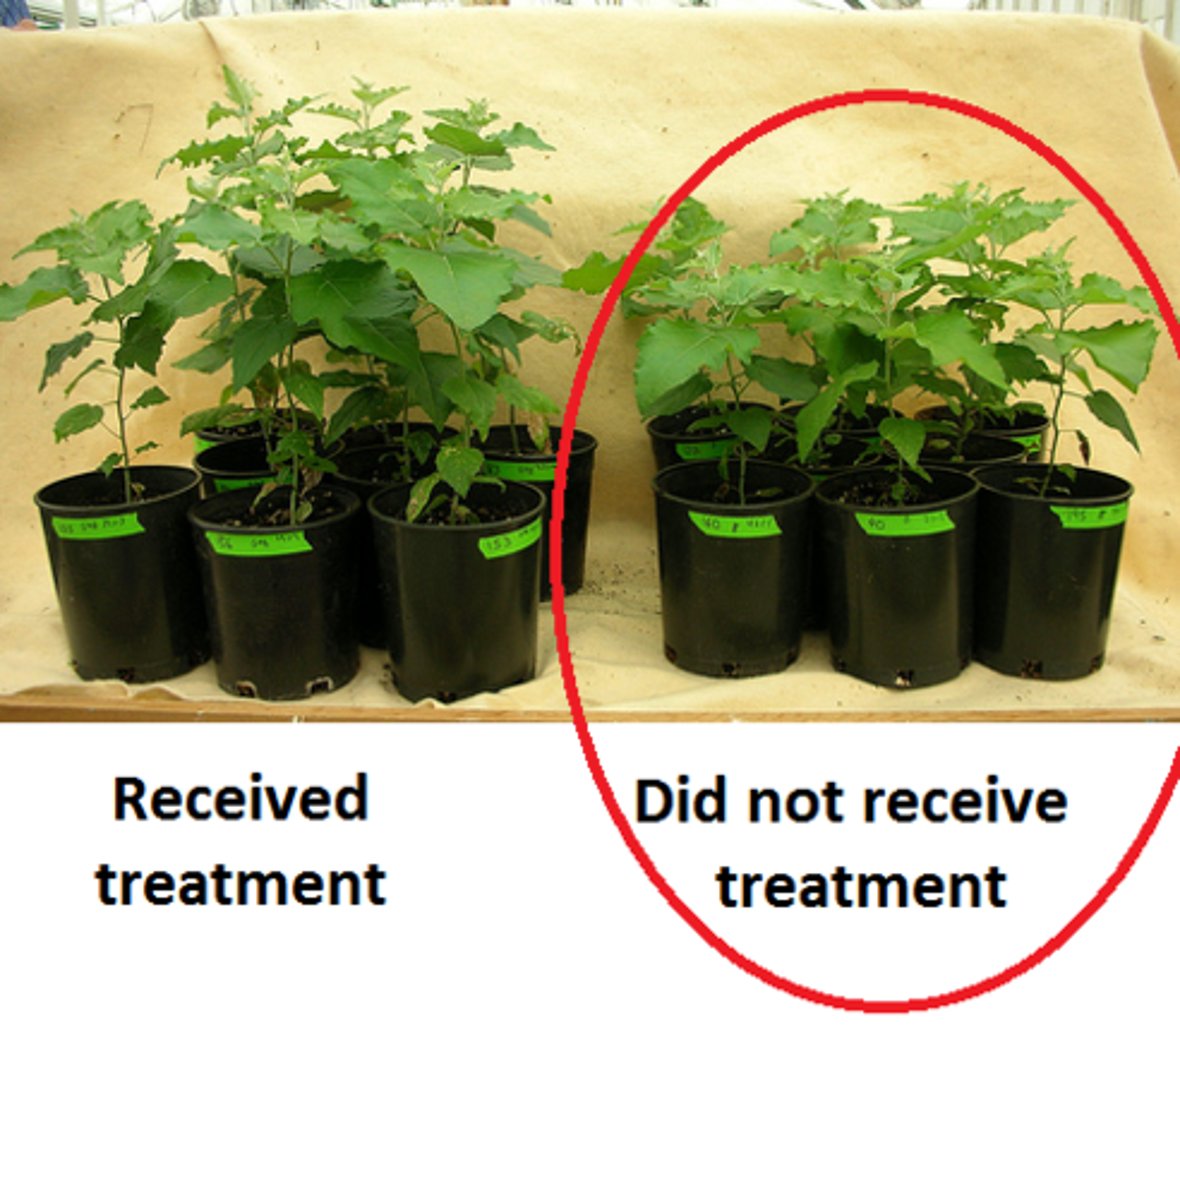
Control group
in an experiment, the group not exposed to the treatment; contrasts with the experimental group and serves as a comparison for evaluating the effect of the treatment.
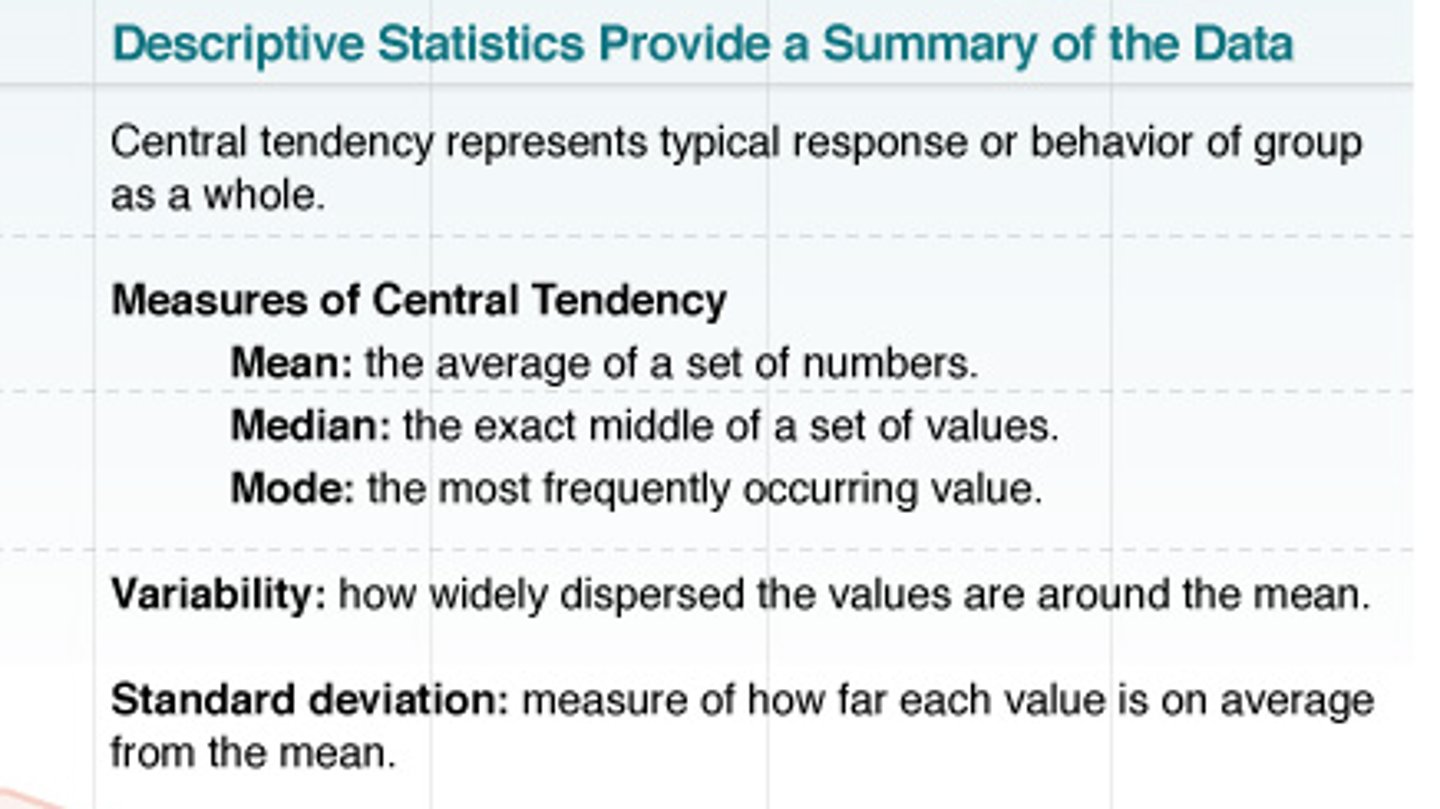
Descriptive statistics
Statistical procedures used to summarize sets of scores with respect to central tendencies, variability, and correlation. They are merely observational and inferences cannot be made.
Standard deviation
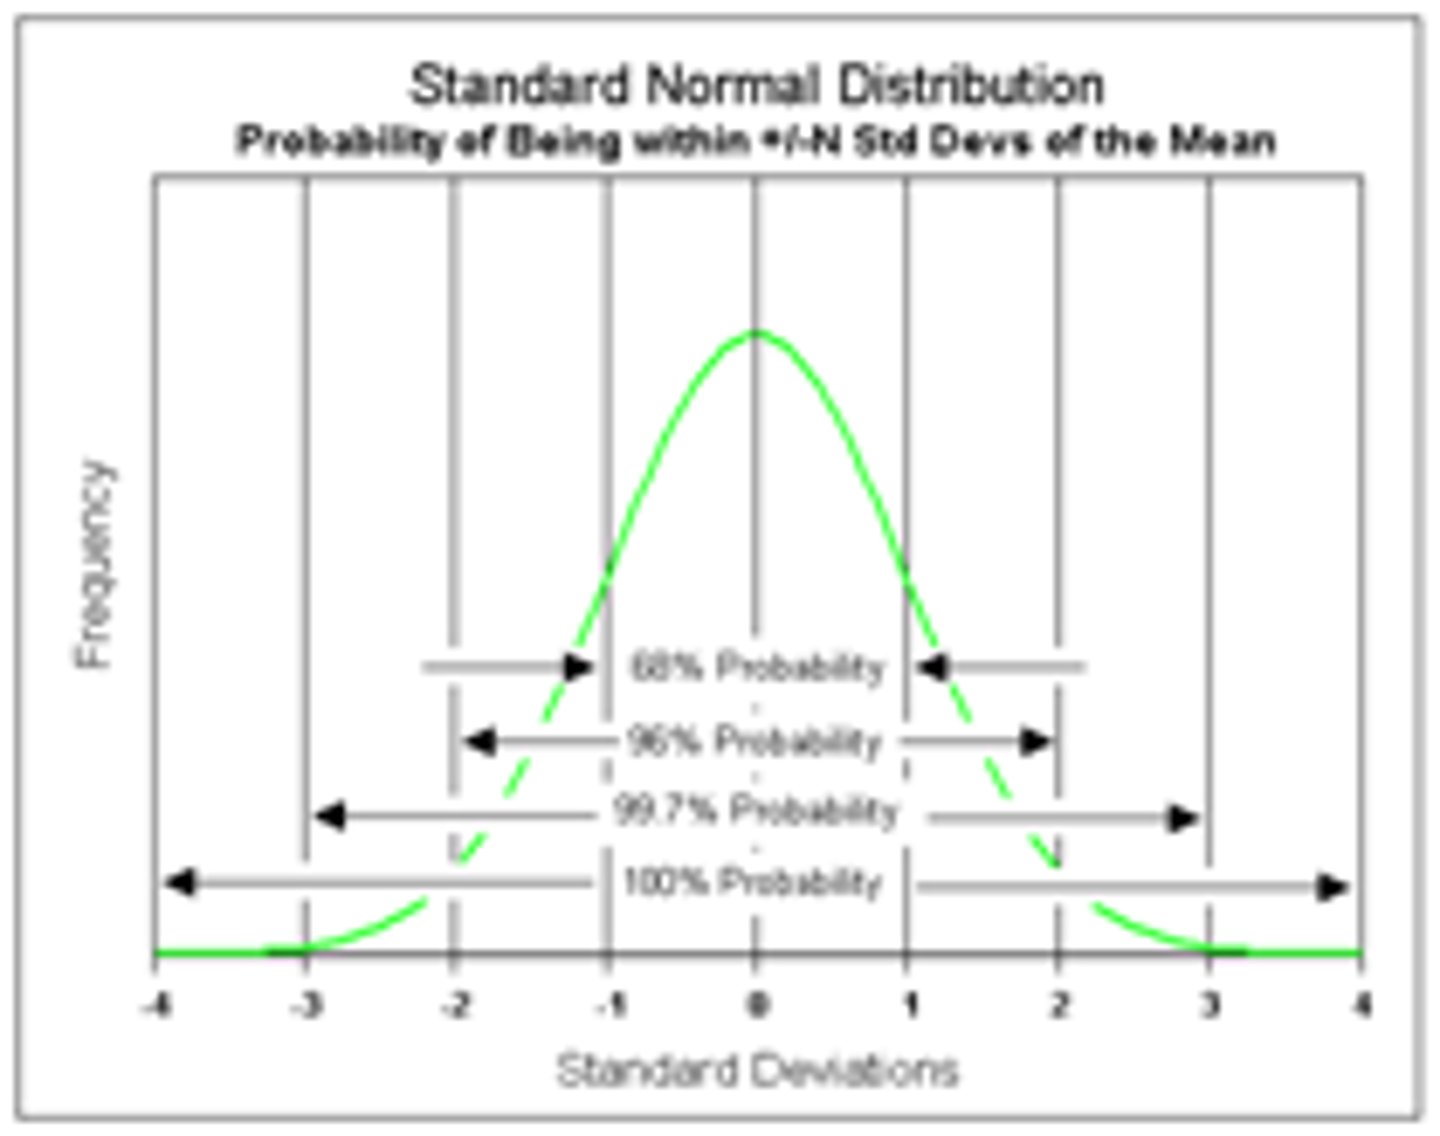
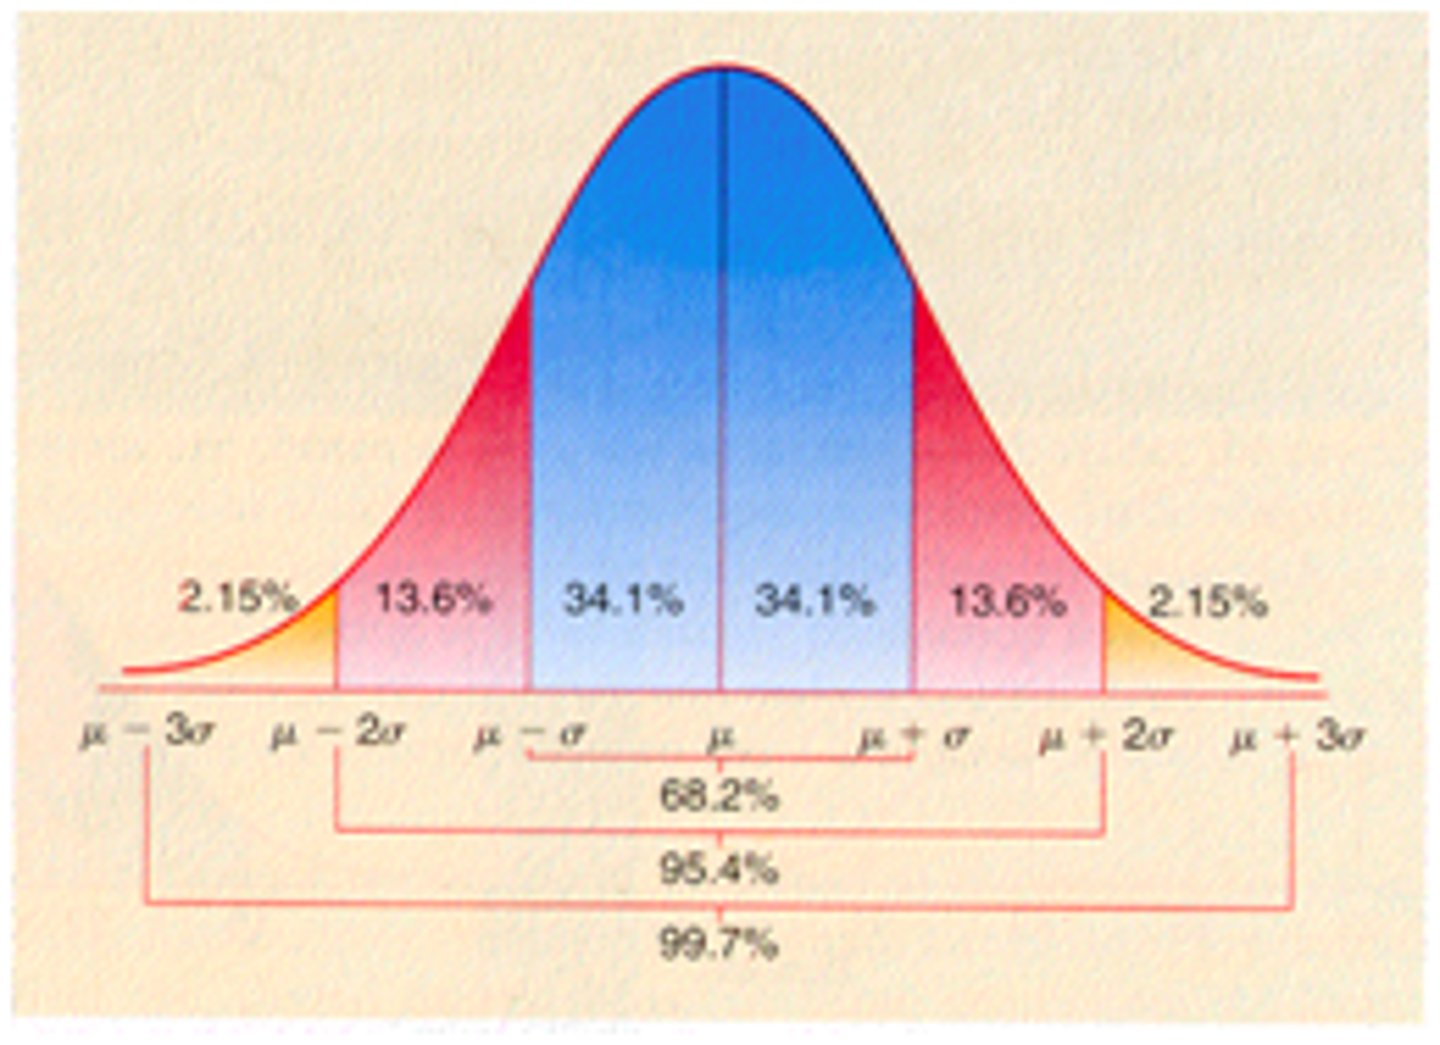
A computed measure of how much scores vary around the mean score. 68% of data is +/- 1 standard deviation away from the mean and 95% of data is +/- 2 standard deviations away from the mean. Think: Normal Bell Curve.
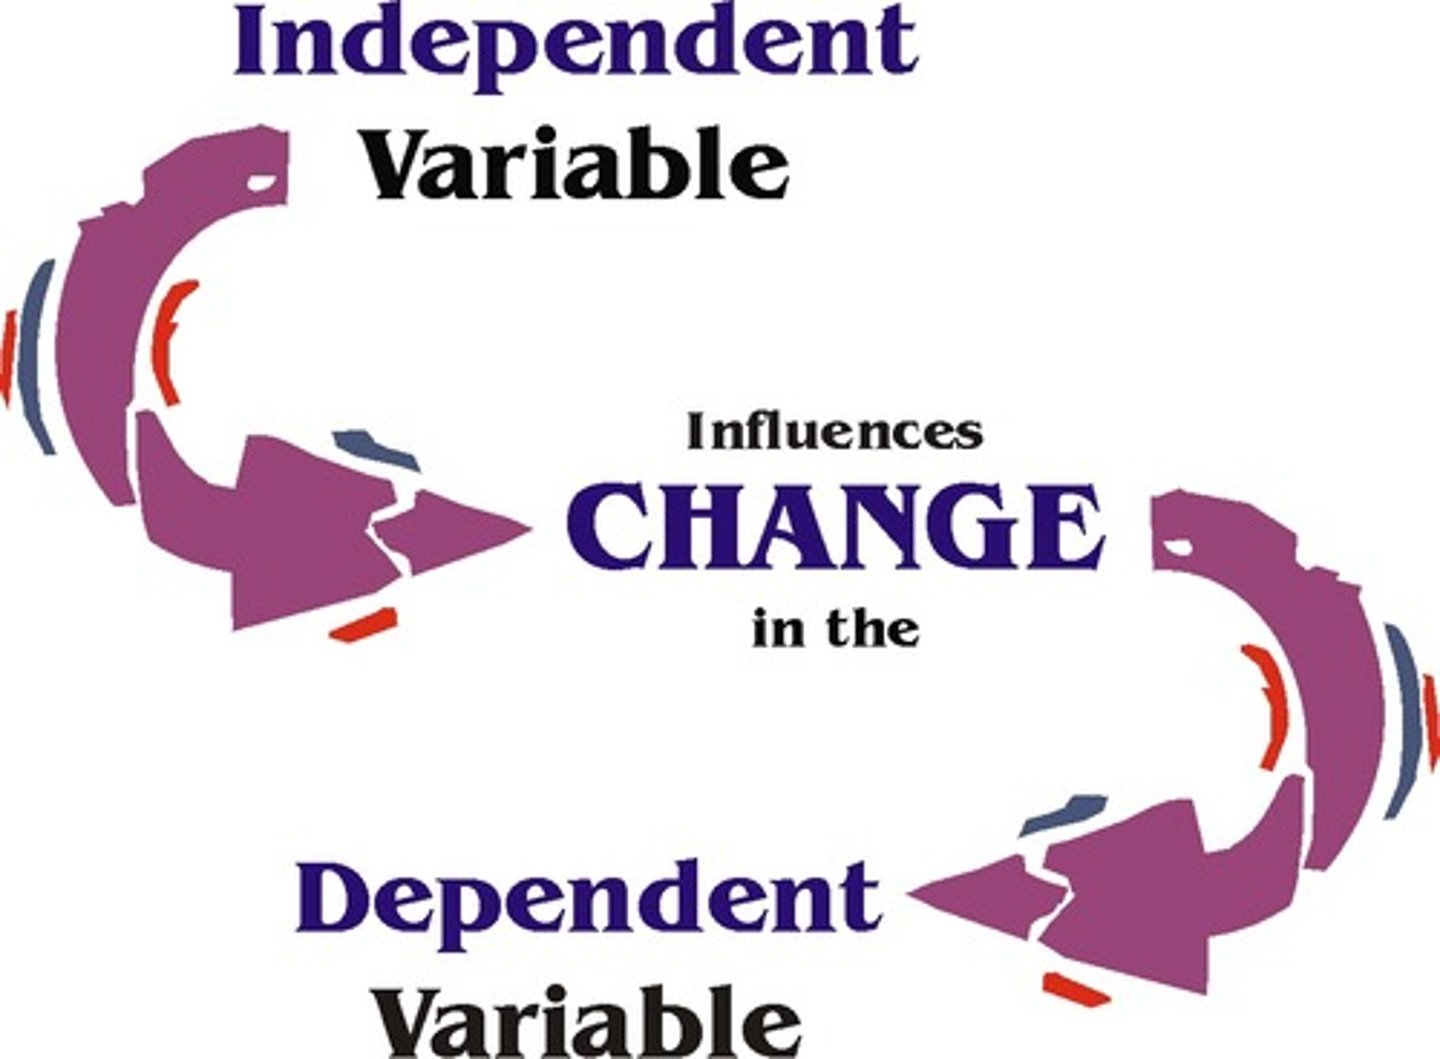
Independent variable
the experimental factor that is manipulated; the variable whose effect are being studied.
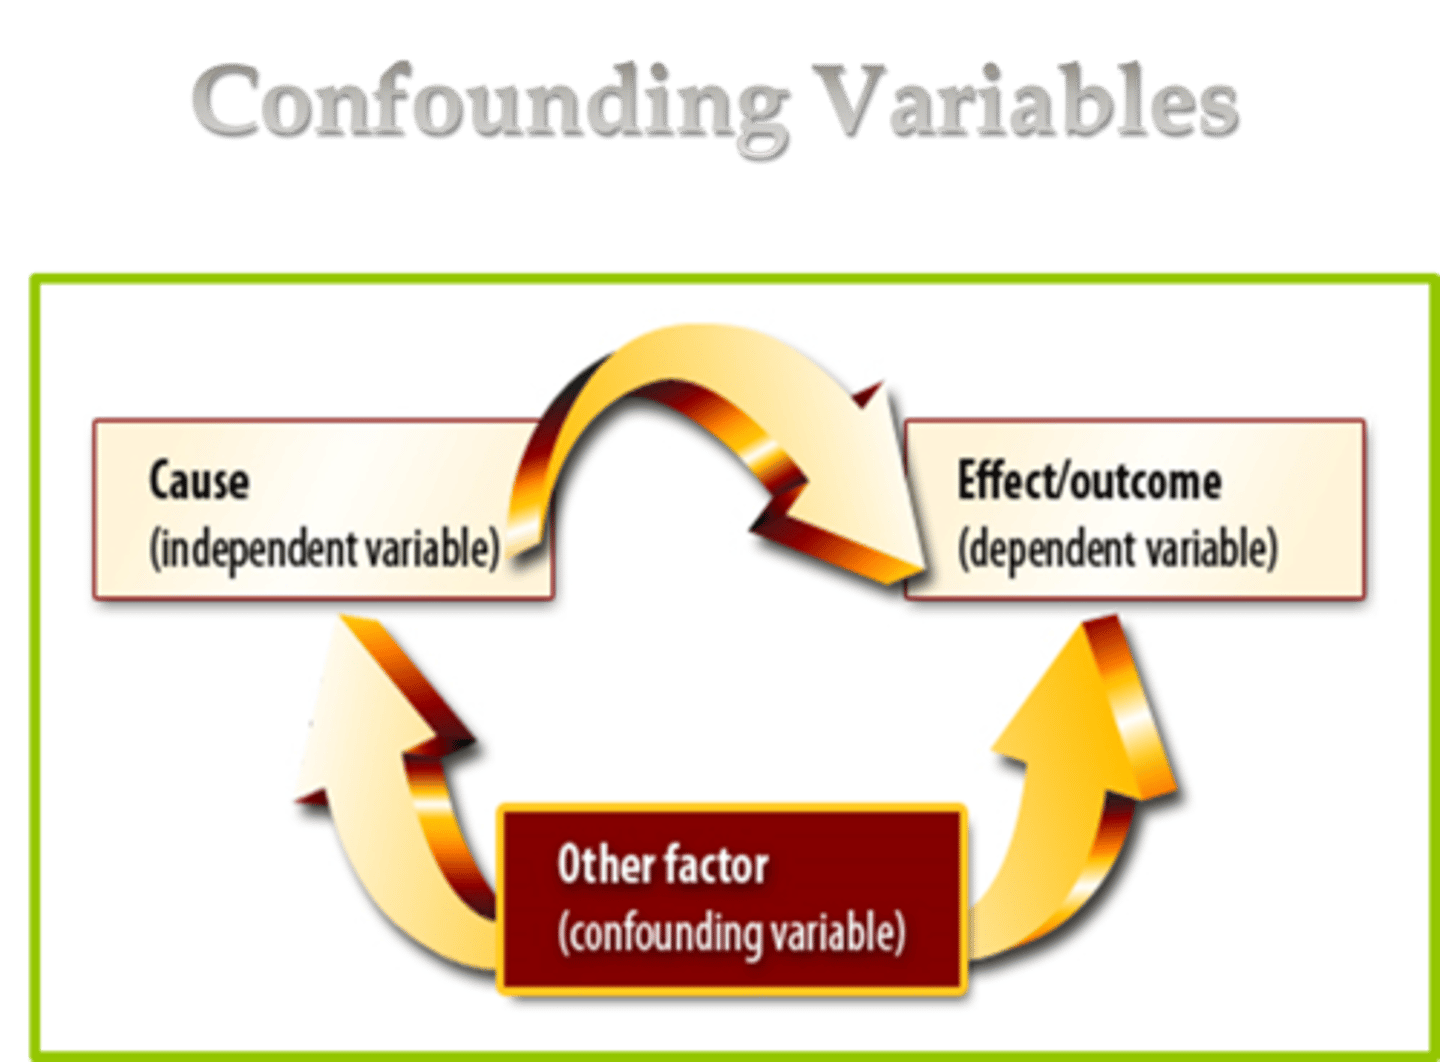
Confounding variable
any other variable that can affect/impact the dependent variable. aka Third Variable, Extraneous Variable.
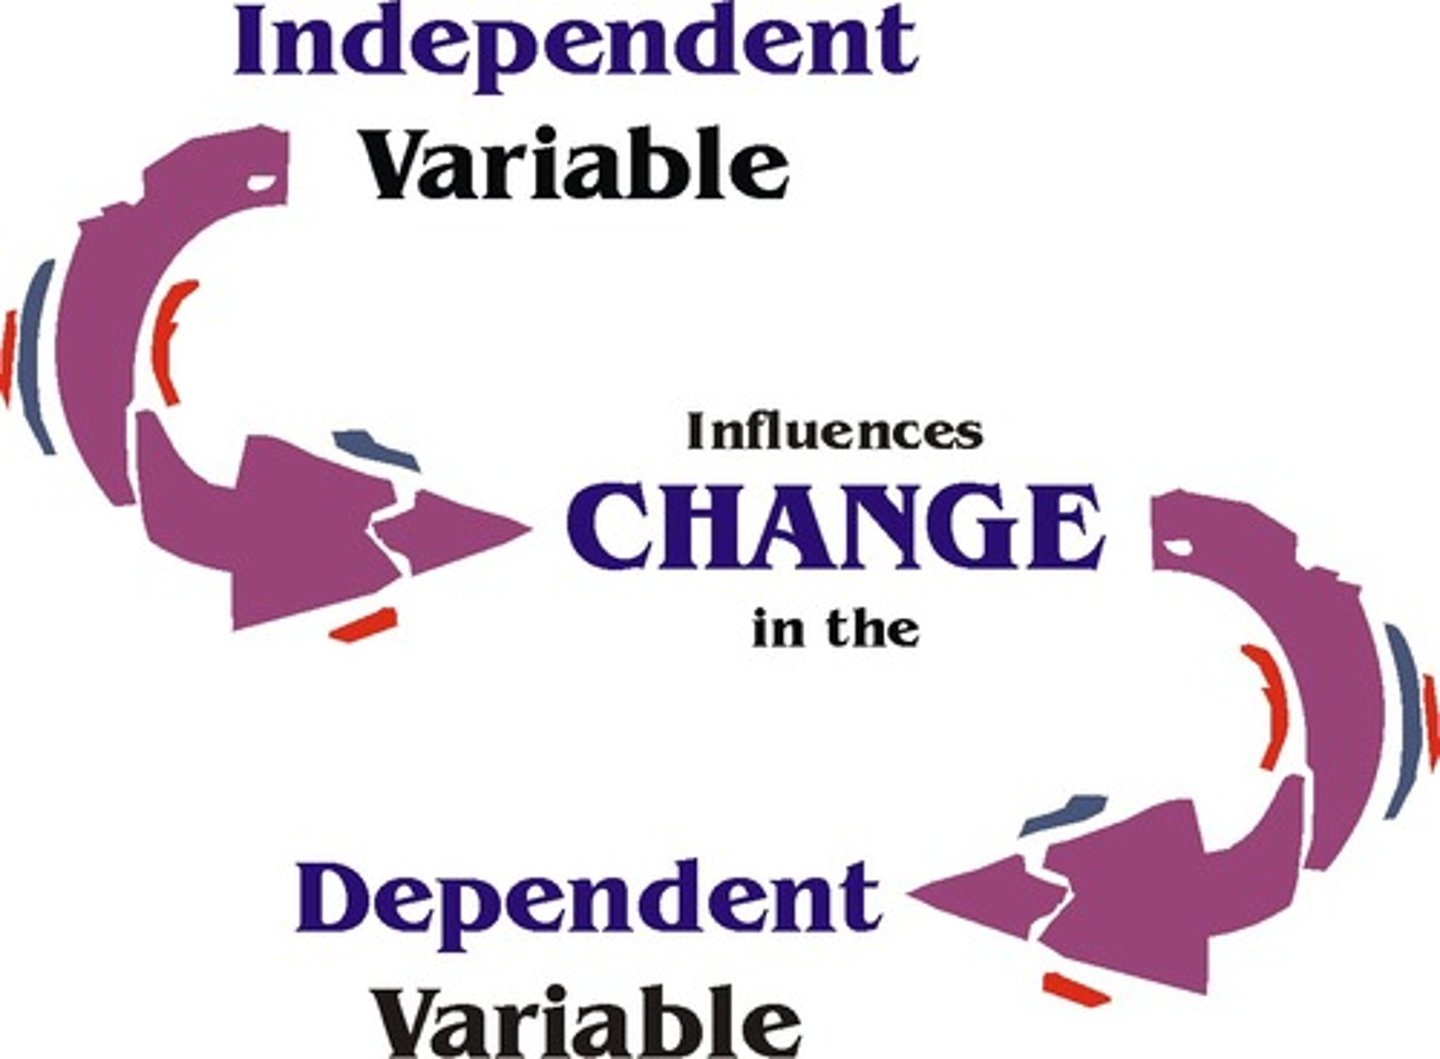
Dependent variable
the outcome factor, what is being measured; the variable that may change in response to manipulations of the independent variable.
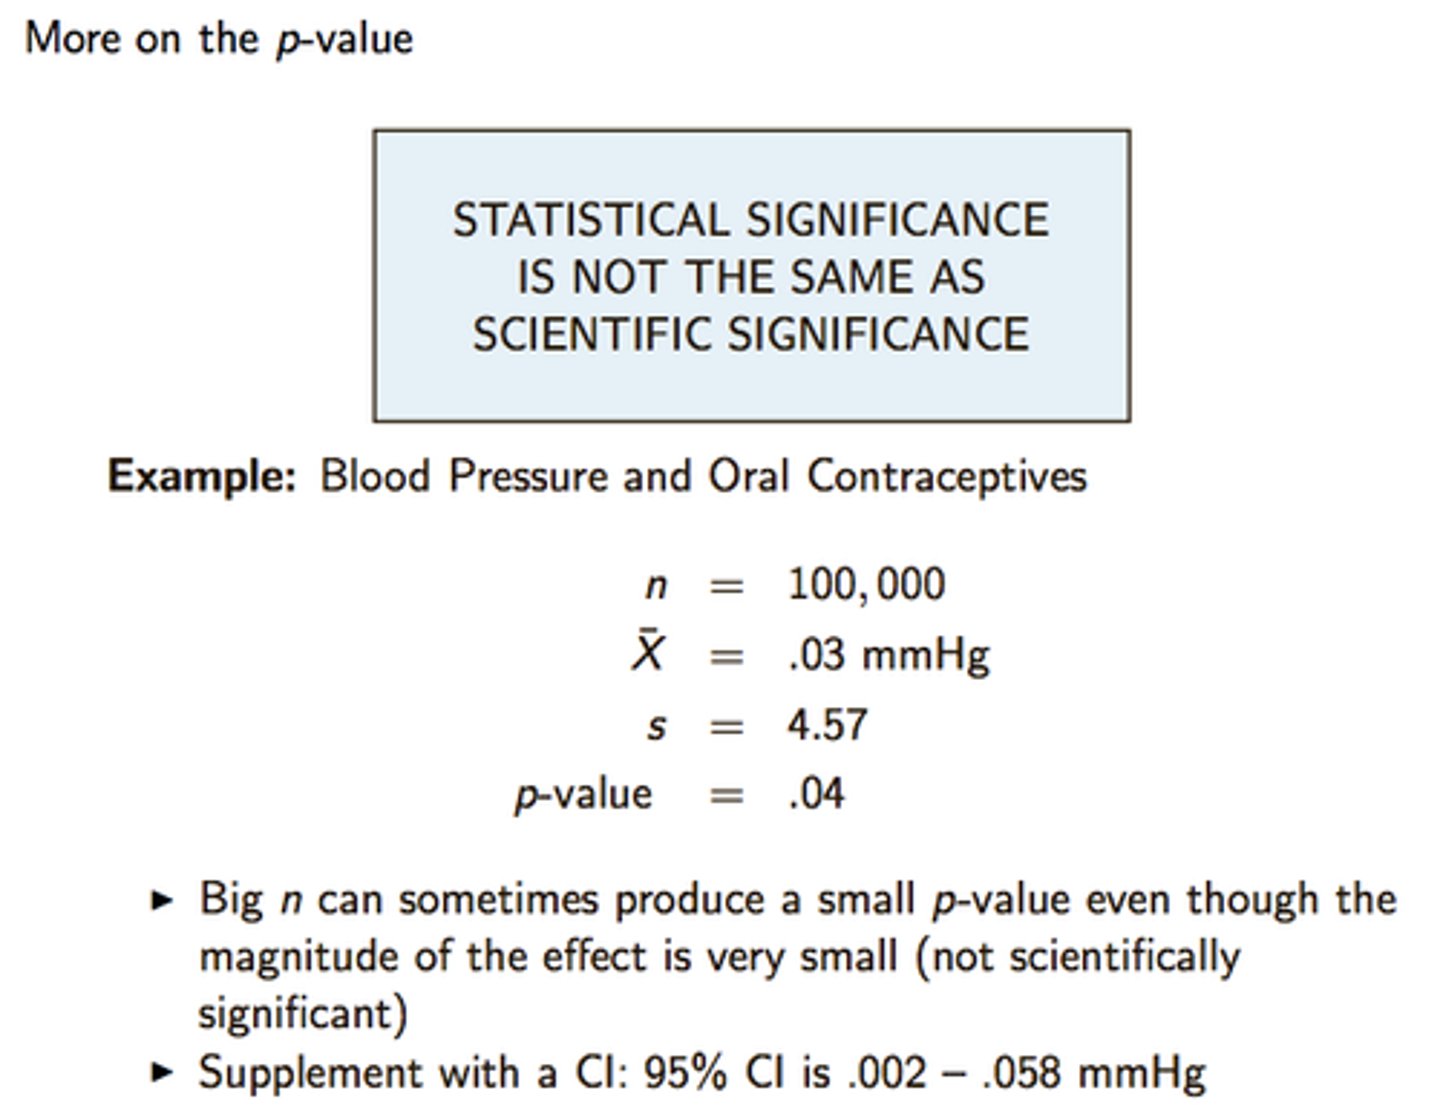
Statistical Significance
The difference between experimental conditions that would have occurred by chance less than 95% of trials. P value is less than .05 (or 5%)
Informed consent
An ethical principle that research participants be told enough to enable them to choose whether they with to participate

Debriefing
the post-experimental explanation of a study, including its purpose an any deceptions, to its participants.
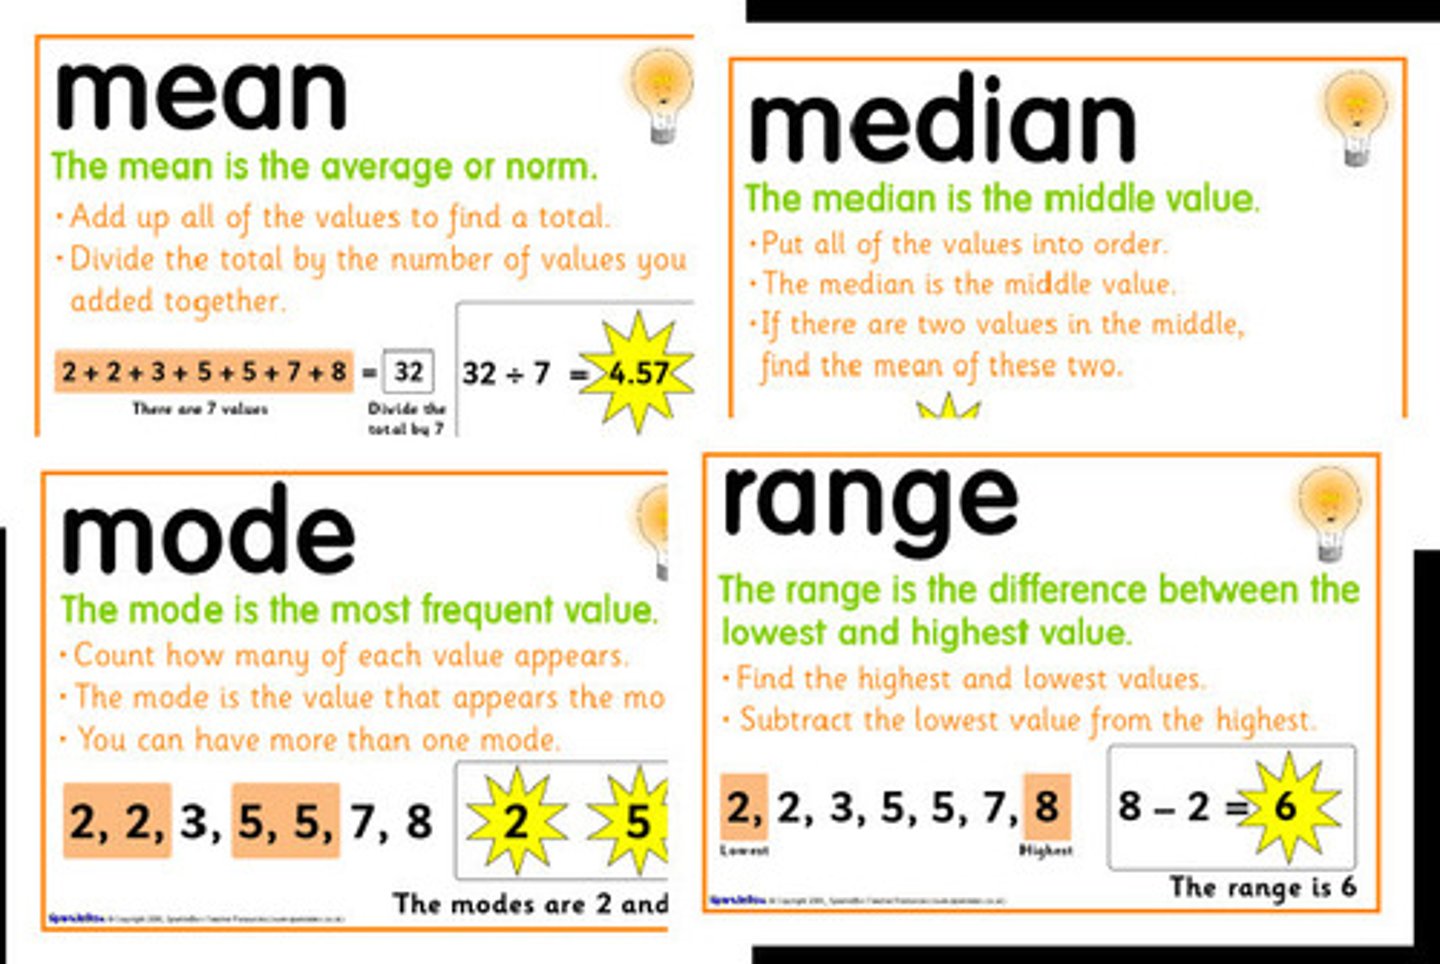
measures of central tendency
mean, median, mode and range
mean
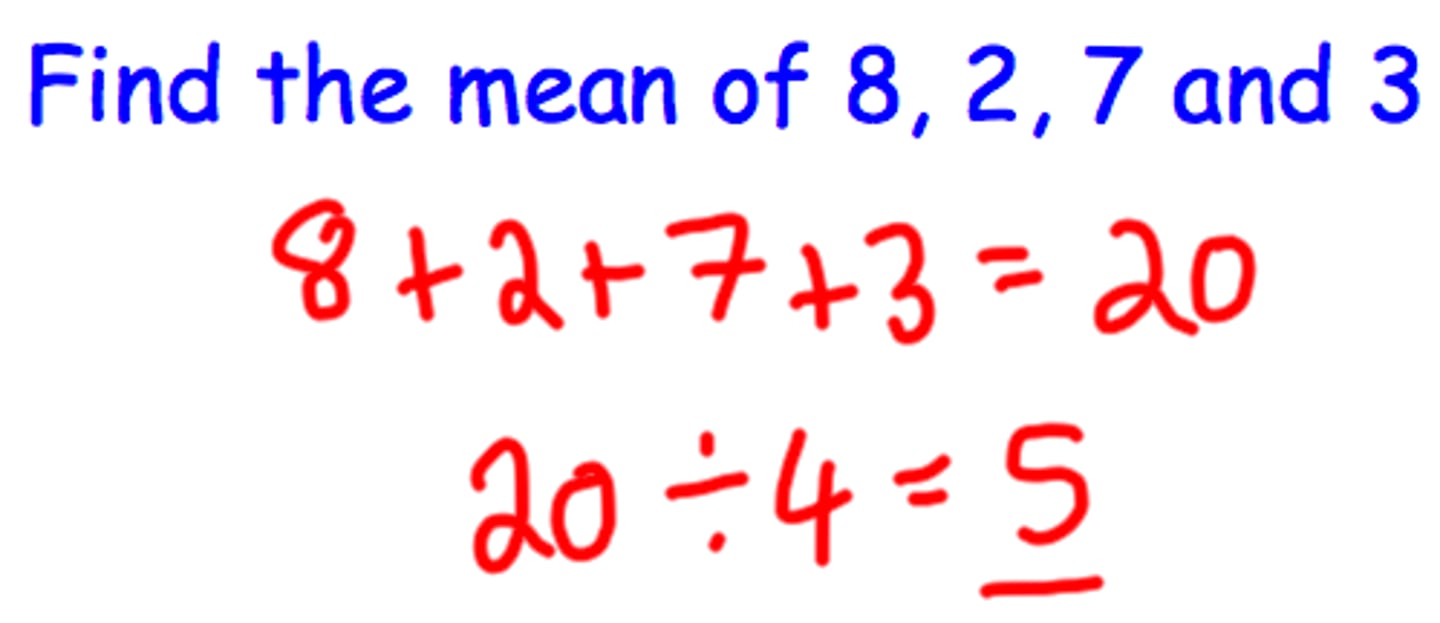
the arithmetic average of a distribution, obtained by adding the scores and then dividing by the number of scores
median
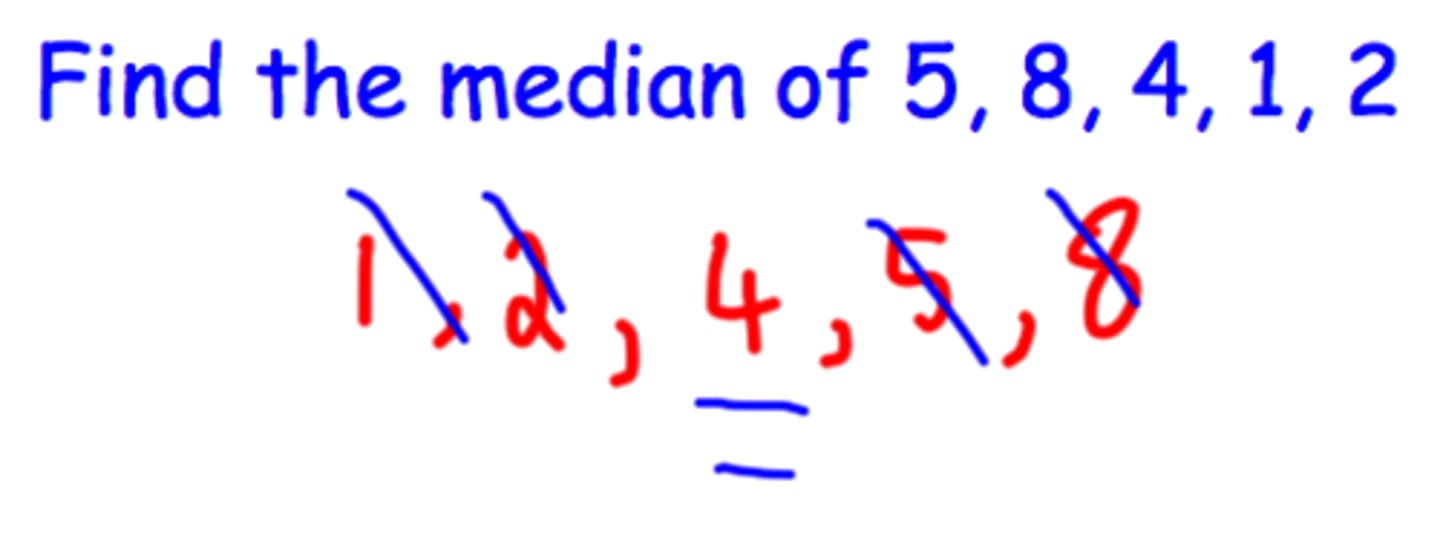
the middle score in a distribution; half the scores are above it and half are below it
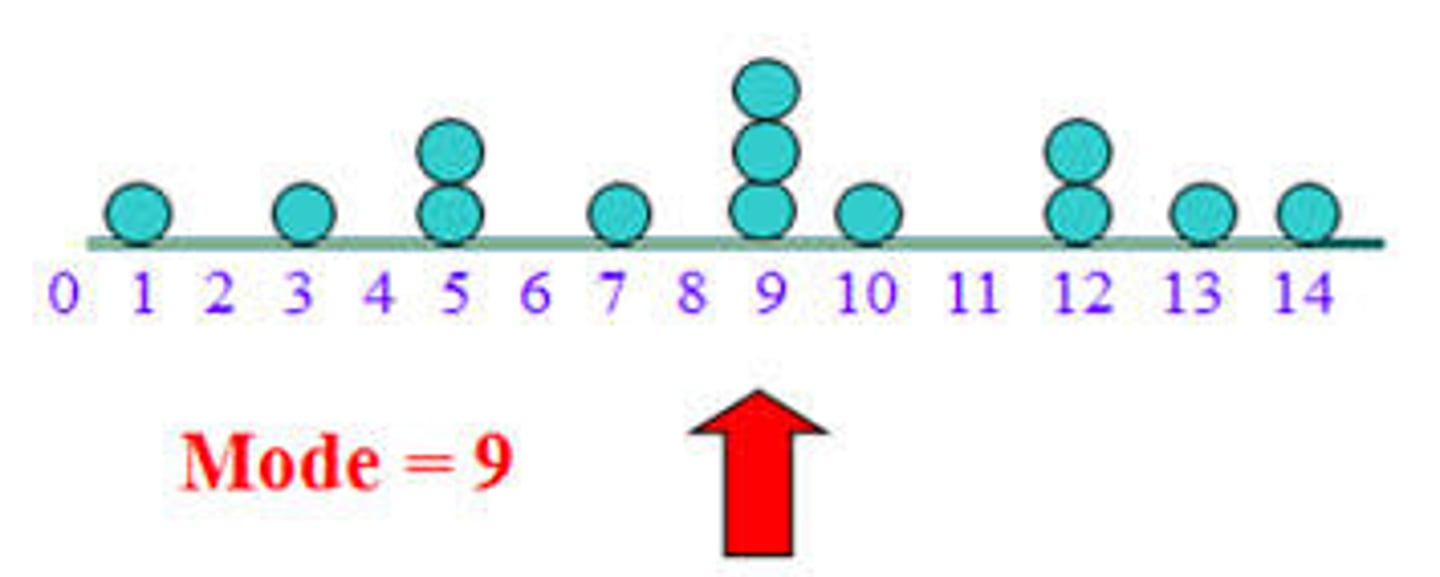
Mode
the most frequently occurring score(s) in a distribution
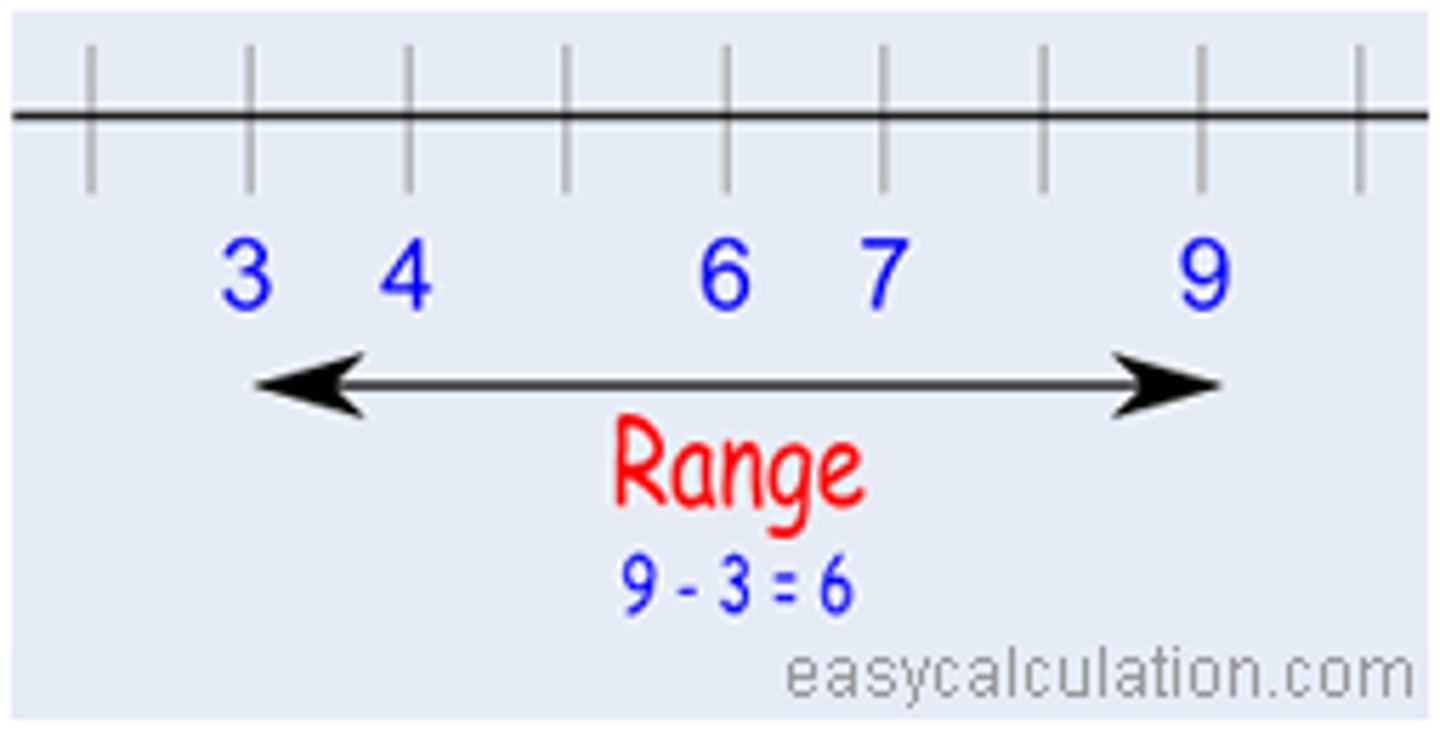
range
the difference between the highest and lowest scores in a distribution
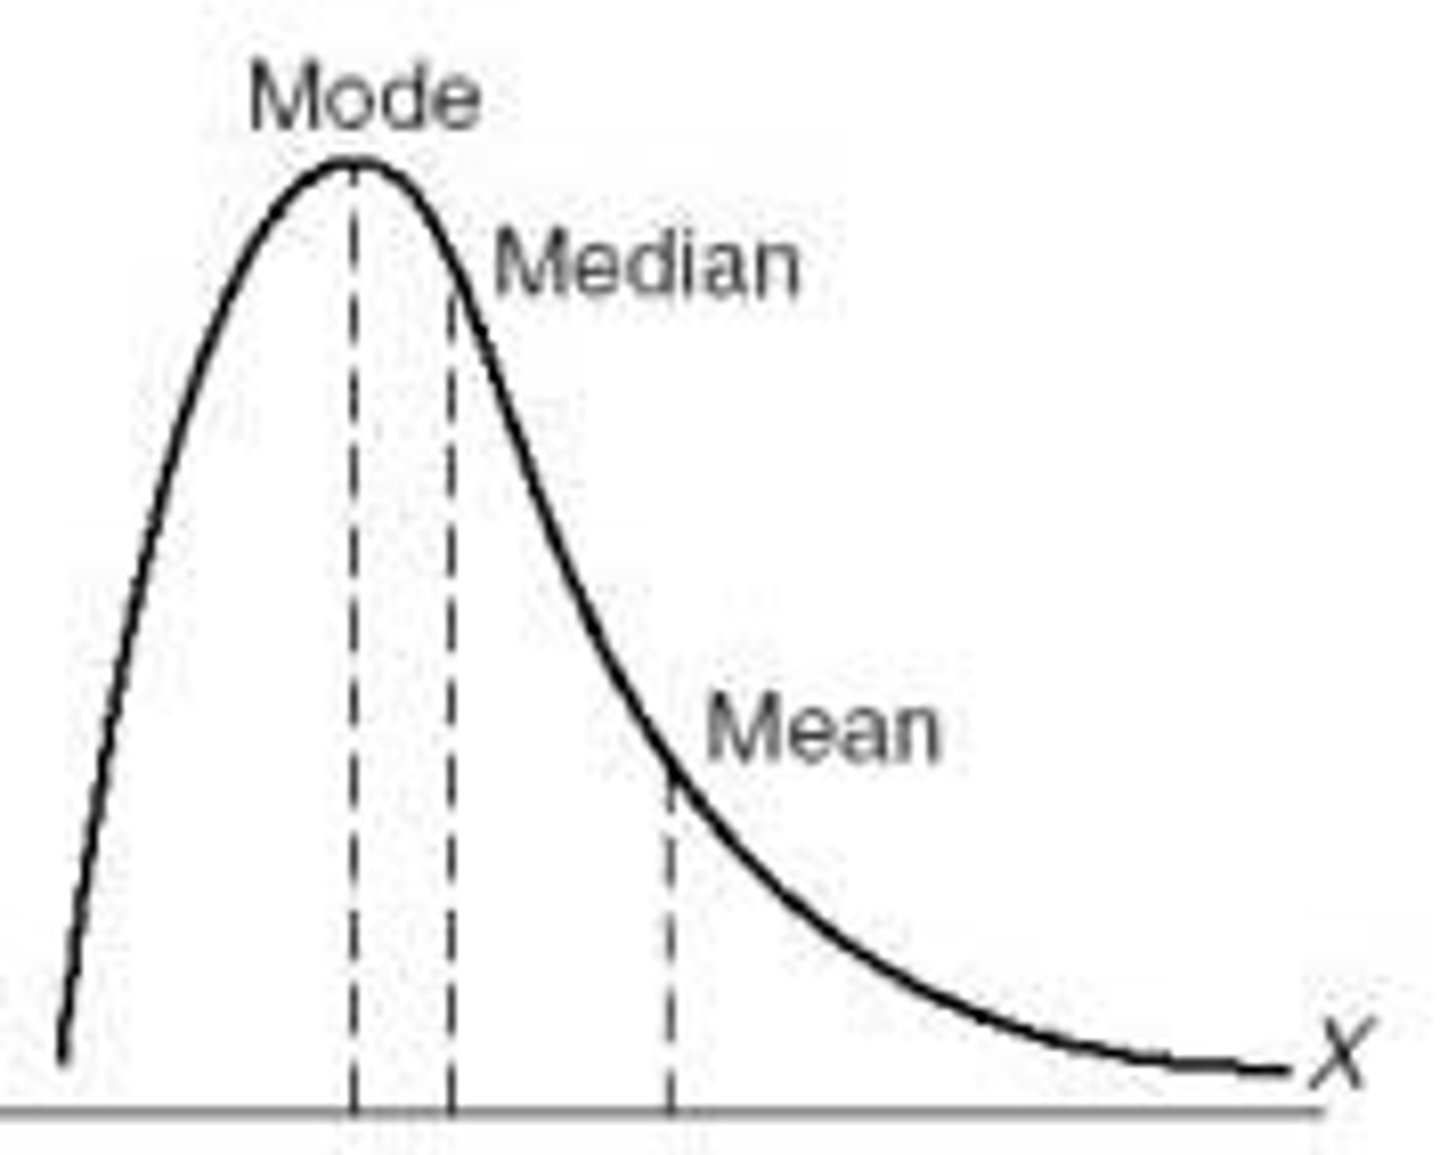
positive skewness
distribution skewed to right mean > median
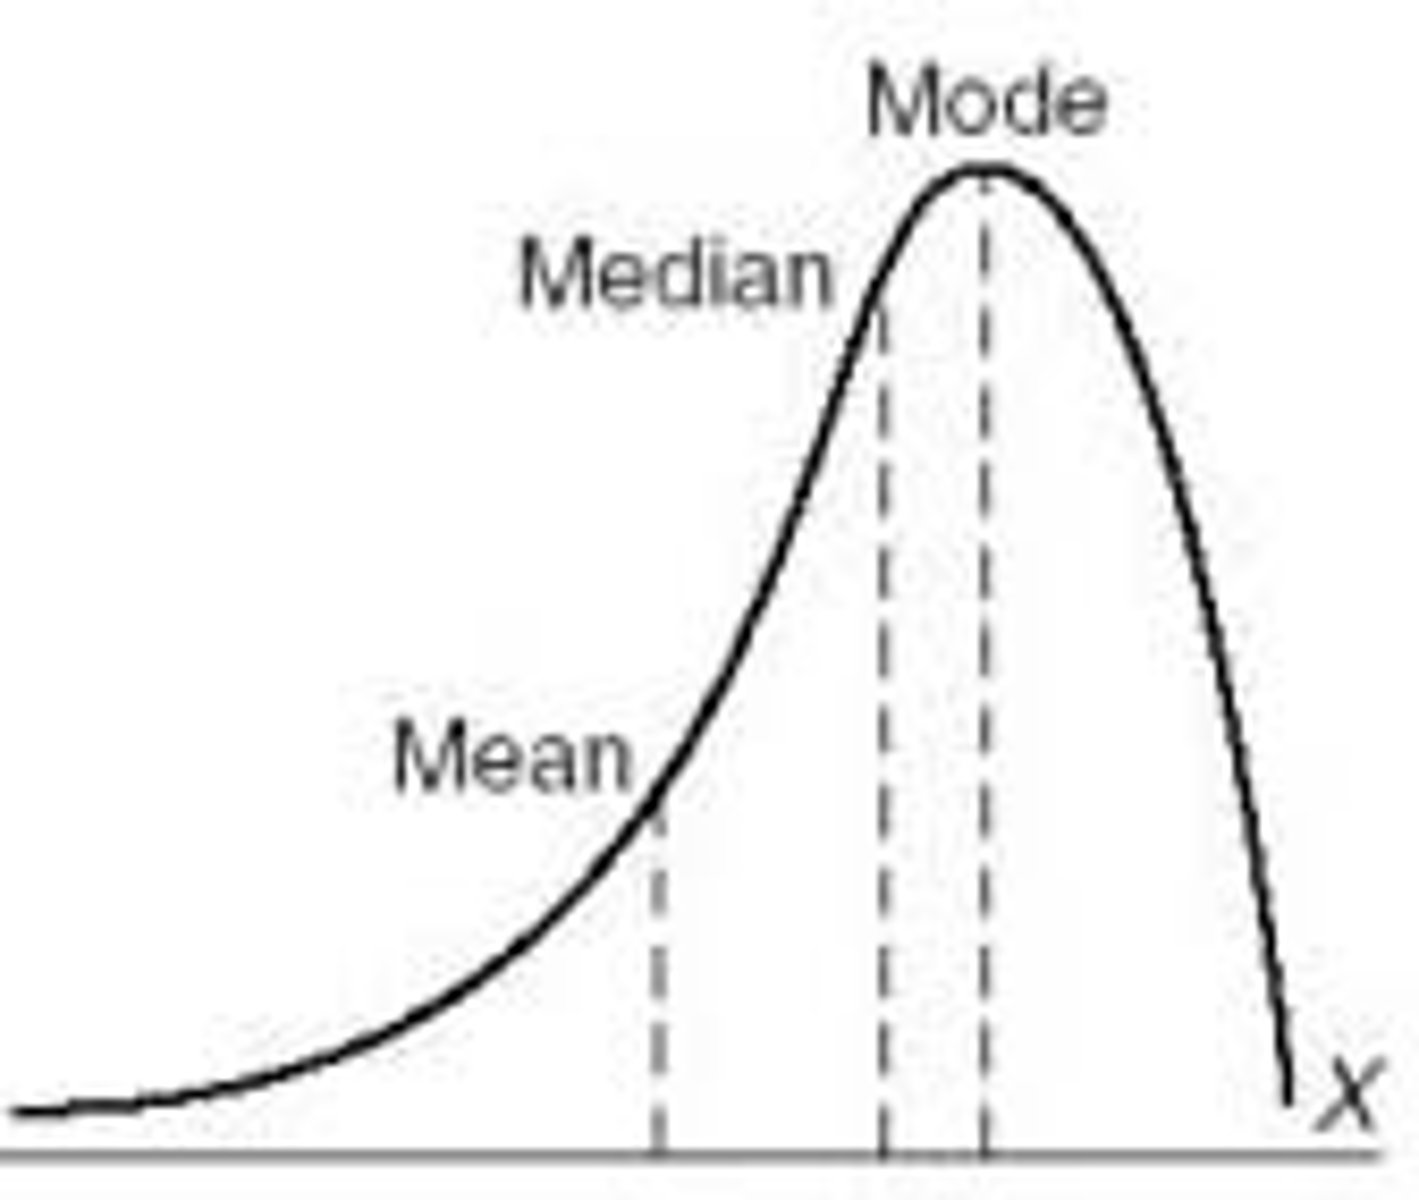
negative skewness
distribution skewed to the left, Mean < median
normal bell curve (normal distribution)
mean, median, mode all the same
68% of data within 1st standard deviation point
95% of data within 2nd standard deviation point
regression to the mean
If the first measurement is extreme, second measurement will be closer to the mean
range
the difference between the highest and lowest scores in a distribution
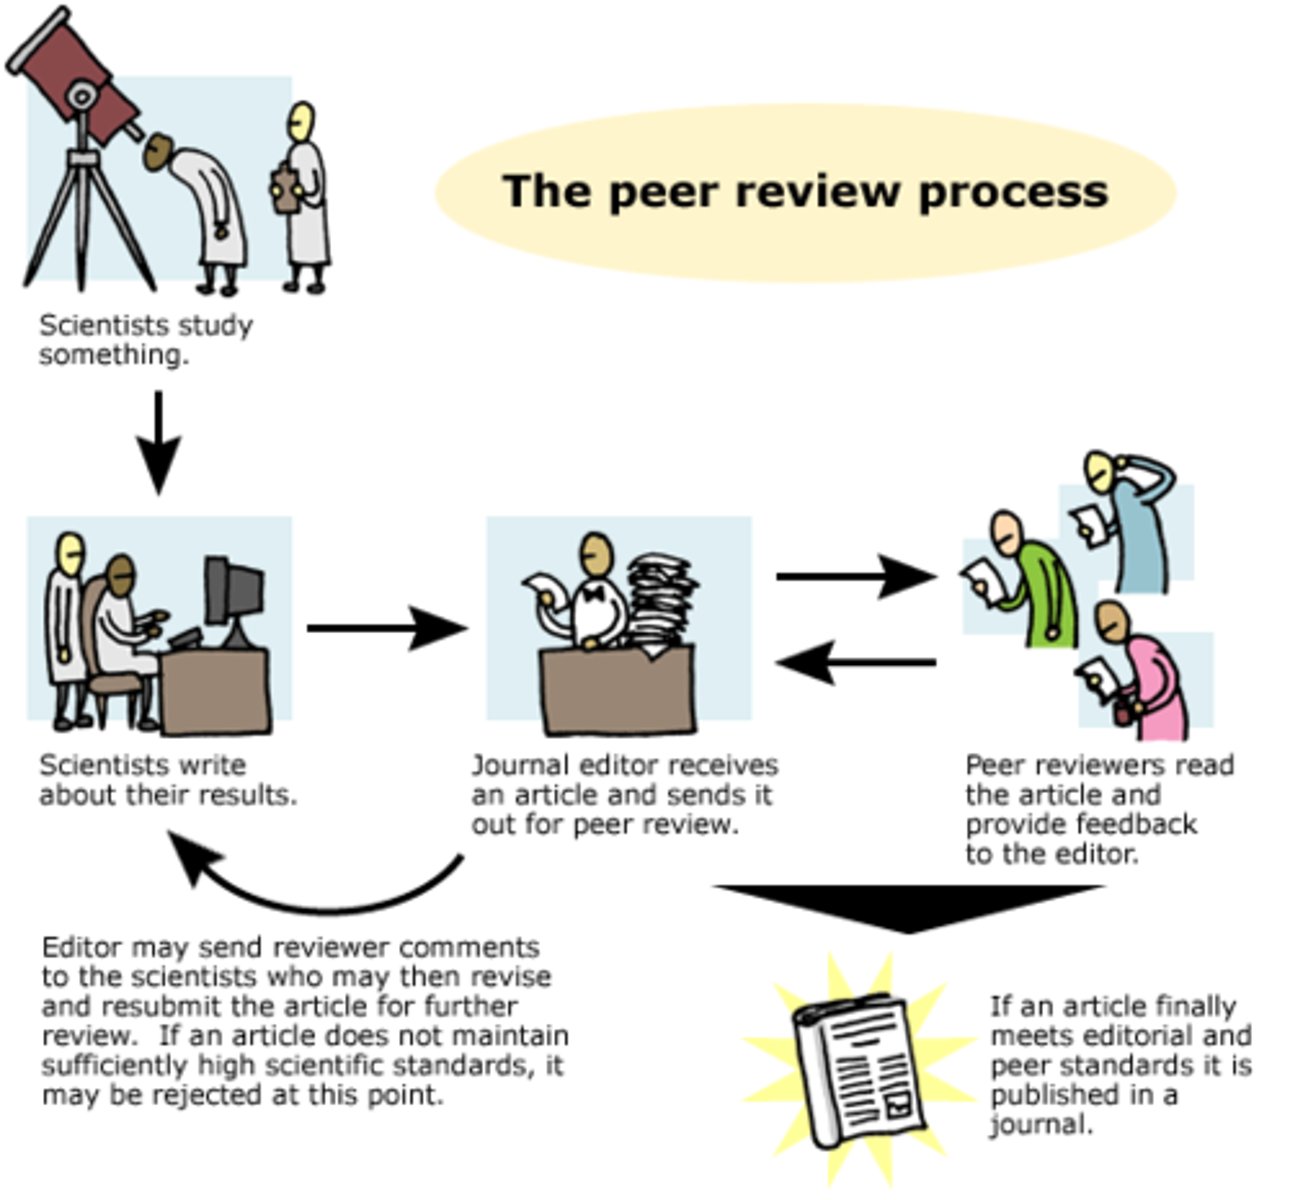
peer review
A process by which the procedures and results of an experiment are evaluated by other scientists who are in the same field or who are conducting similar research.
Theory
well-tested explanation that unifies a broad range of observations, NOT a "hunch".
social desirability bias
the tendency for people to say what they believe is appropriate or acceptable by others
self-report bias
bias when people report their behavior inaccurately
Scatterplot
a graphed cluster of dots, each of which represents the values of two variables
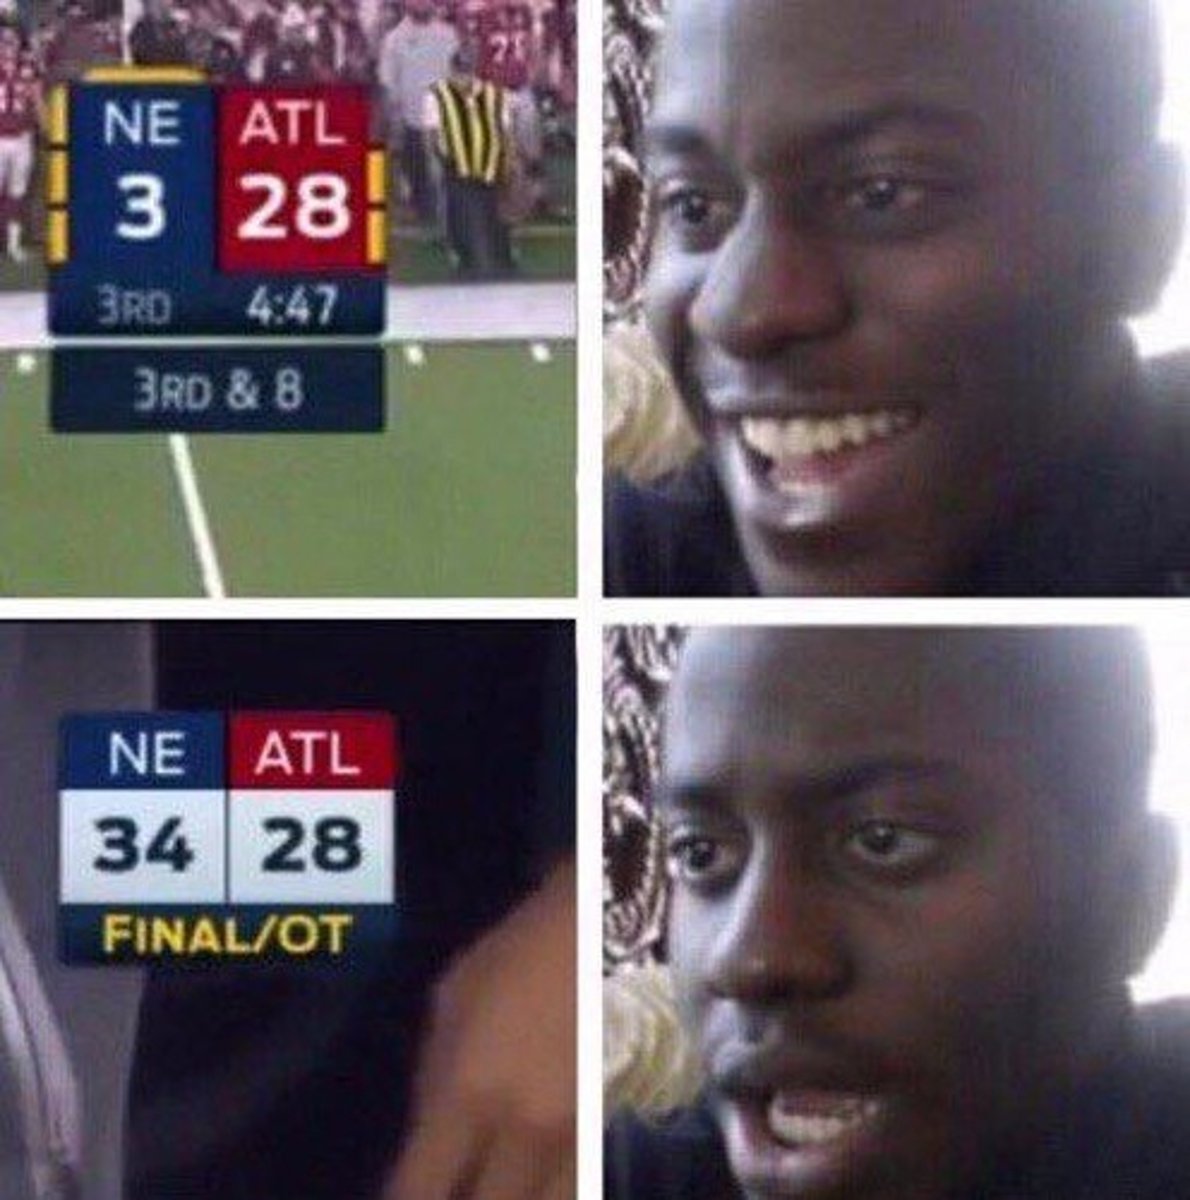
regression toward the mean
the tendency for extreme or unusual scores to fall back (regress) toward their average.
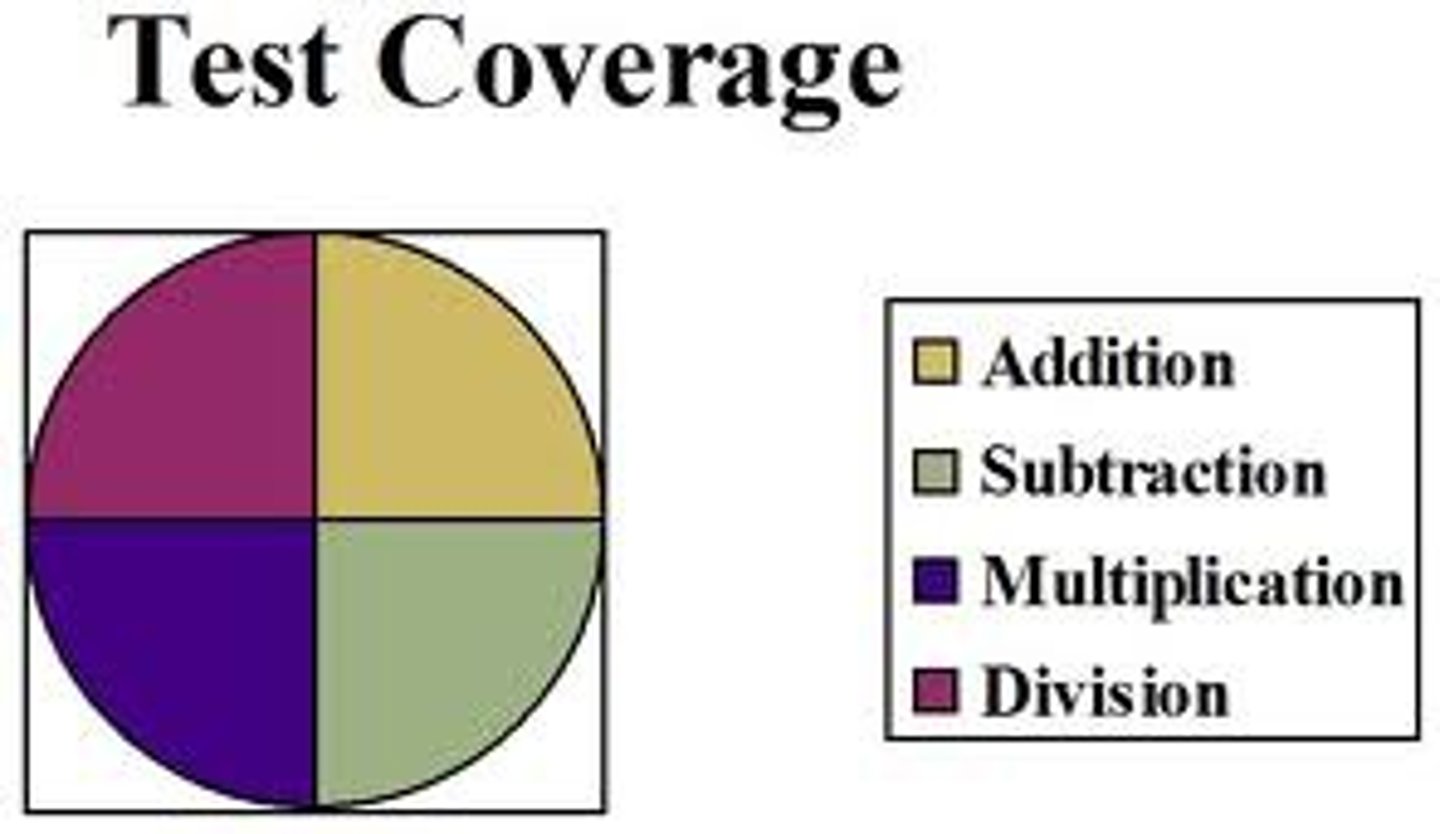
Validity
the extent to which a test measures or predicts what it is supposed to. Ex: Drivers ed test is about driving, not physics.
experimenter bias
a phenomenon that occurs when a researcher's expectations or preferences about the outcome of a study influence the results obtained
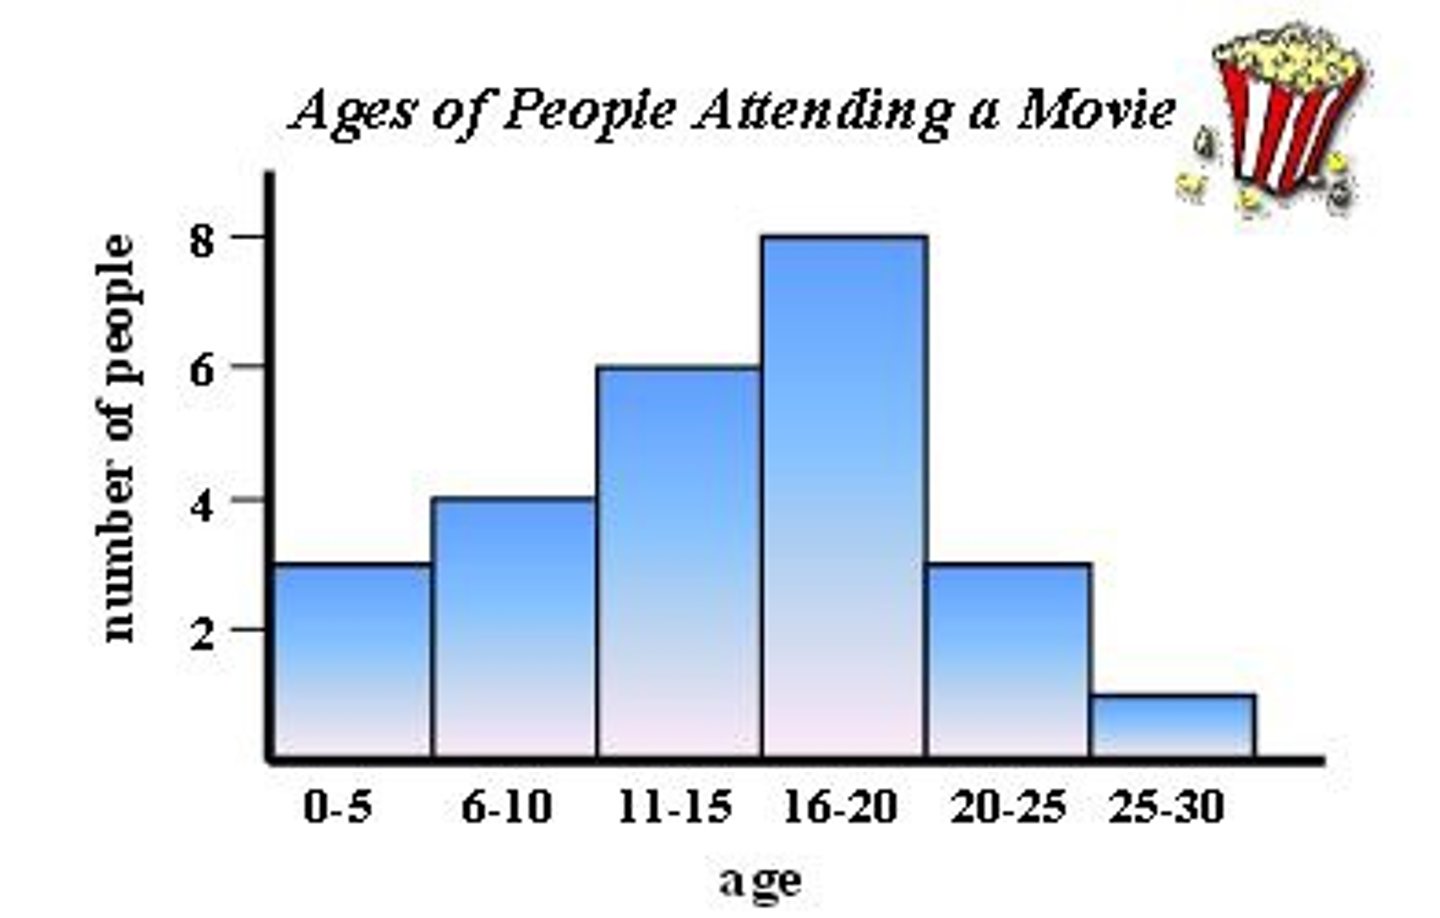
Histogram
a bar graph depicting a frequency distribution
percentile rank
the percentage of scores below a specific score in a distribution of scores
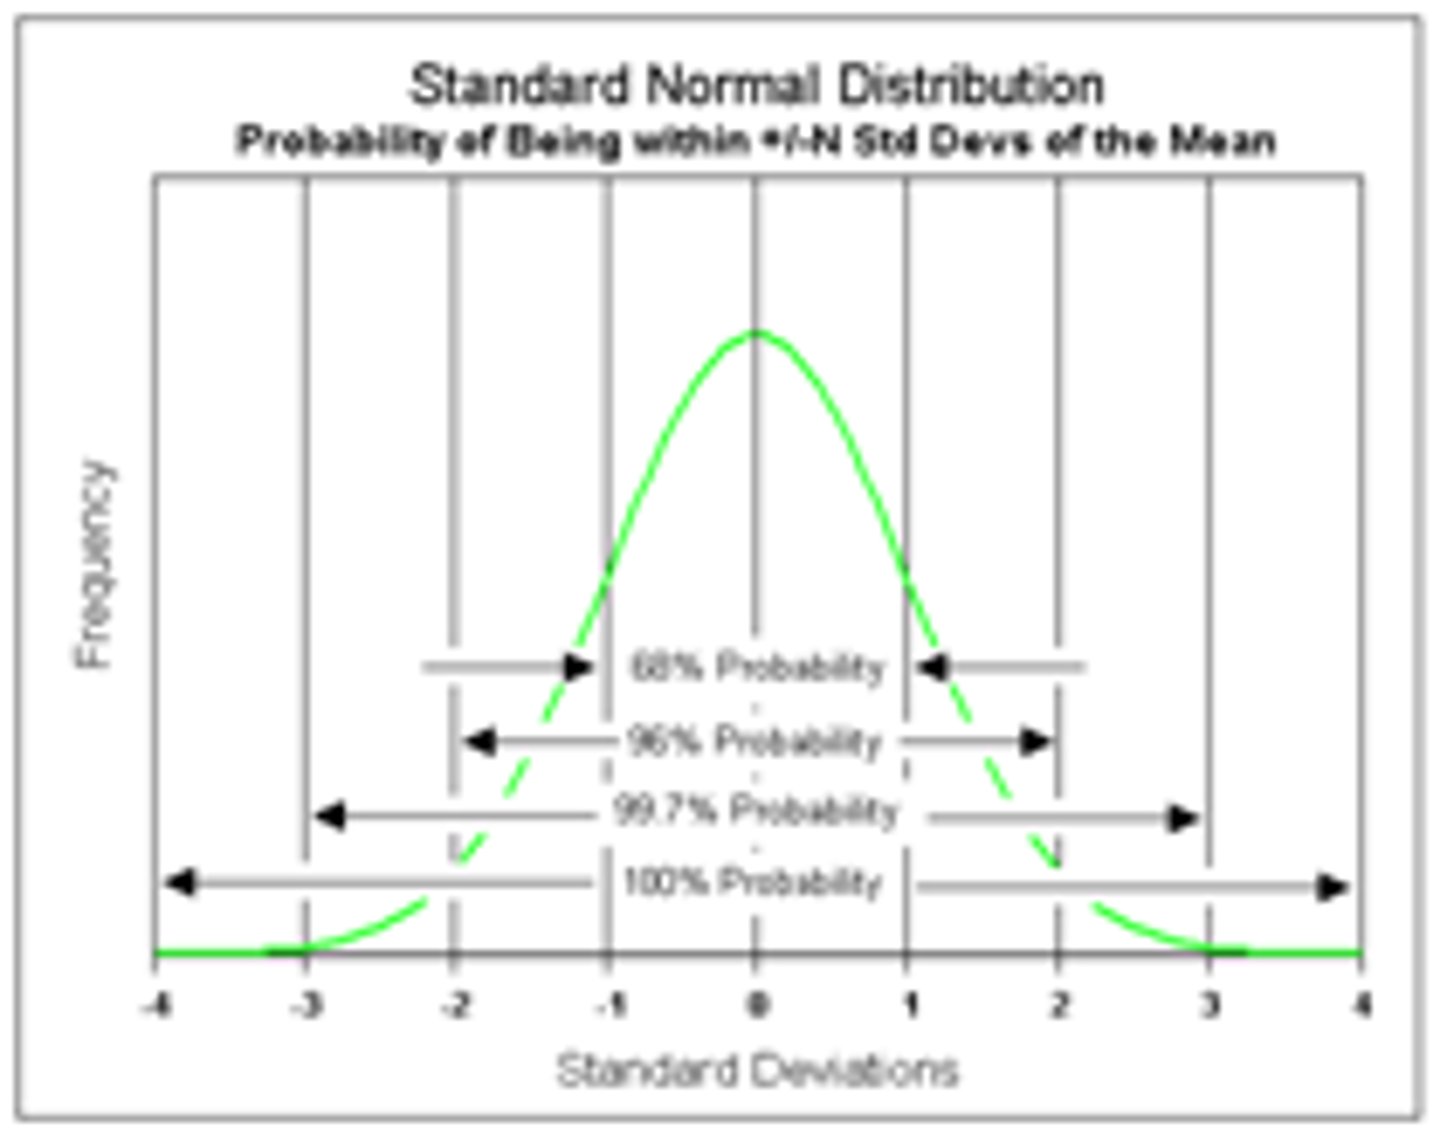
normal curve (normal distribution)
the symmetrical bell-shaped curve that describes the distribution of many physical and psychological attributes. Most scores fall near the average, and fewer and fewer scores lie near the extremes.
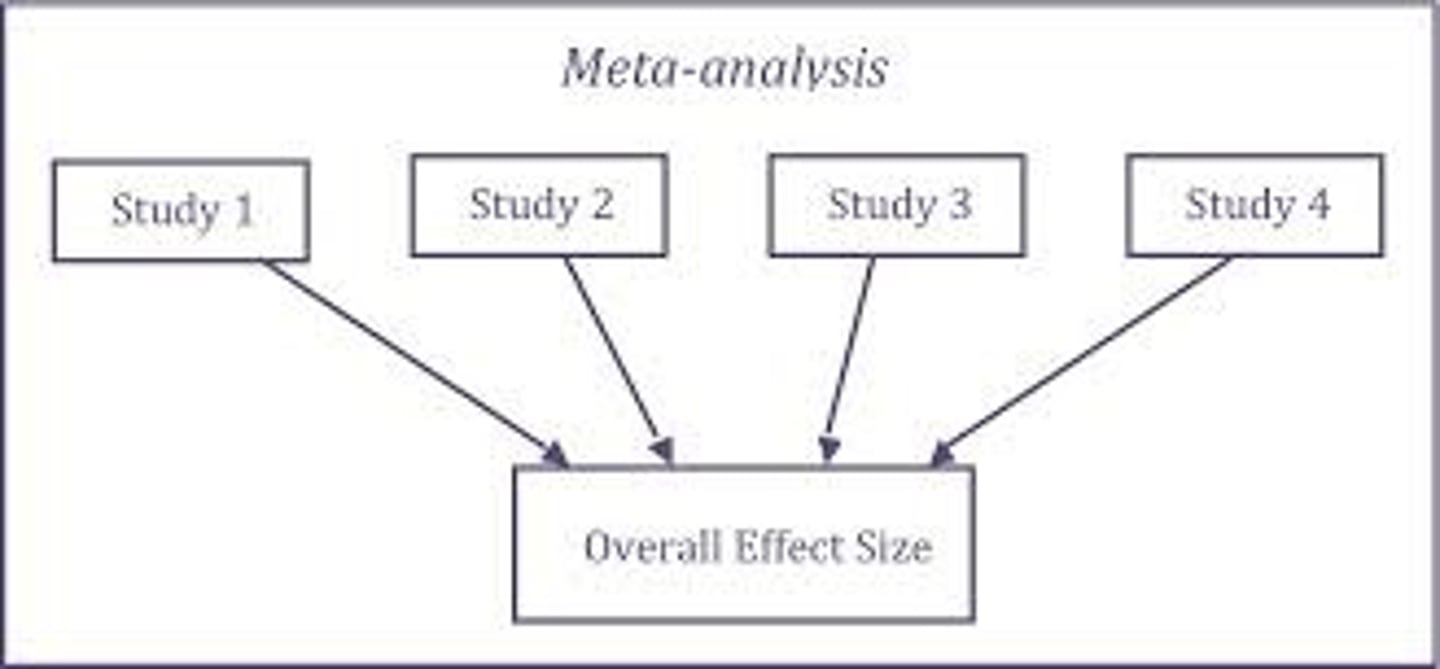
meta-analysis
a procedure for statistically combining the results of many different research studies
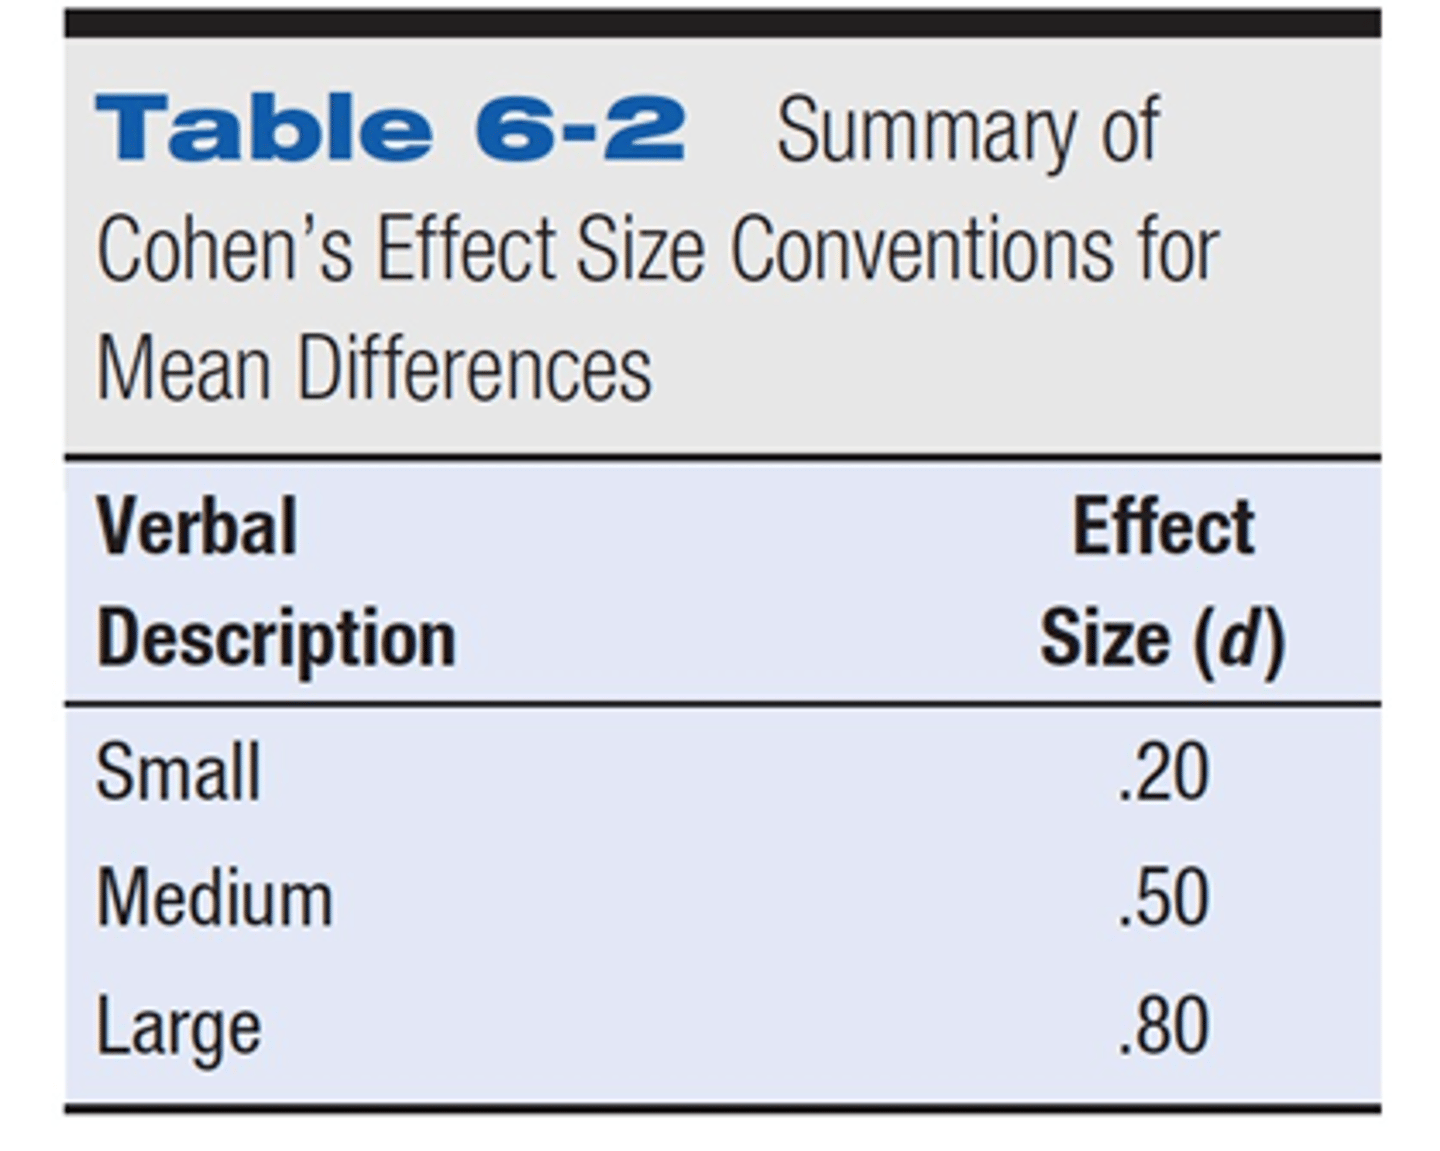
effect size
a measure of the strength of the relationship between two variables or the extent of an experimental effect
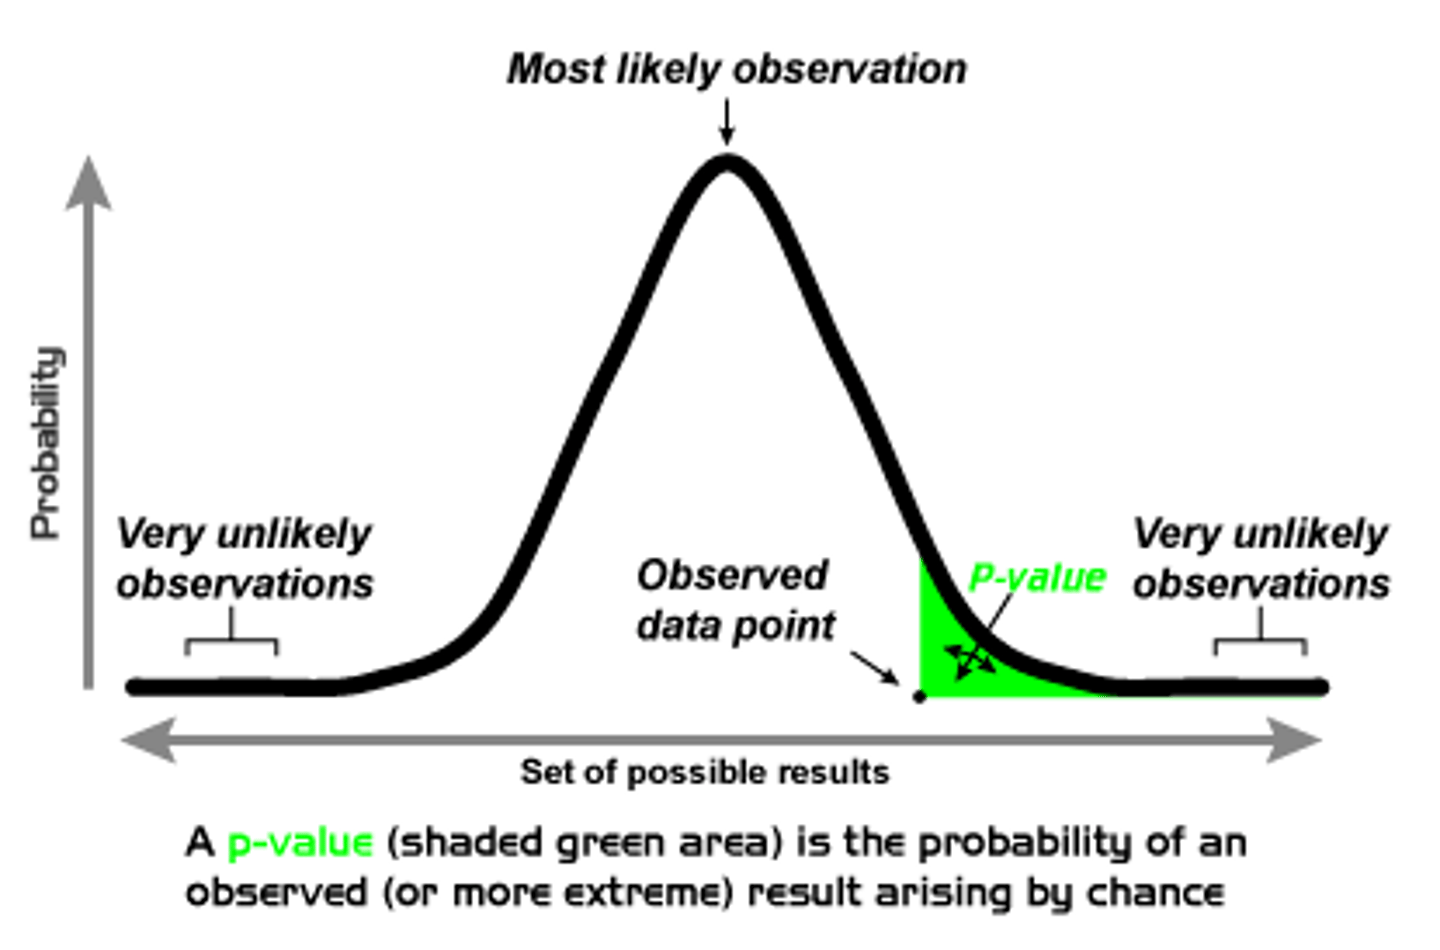
statistical significance (p-value)
a statistical statement of how likely it is that an obtained result occurred by chance
infernetial statistics
involve drawing conclusions ab the population based on a random probability sample of that population.
eclectic approach/perspective
an approach to psychotherapy that uses techniques from various forms of therapy
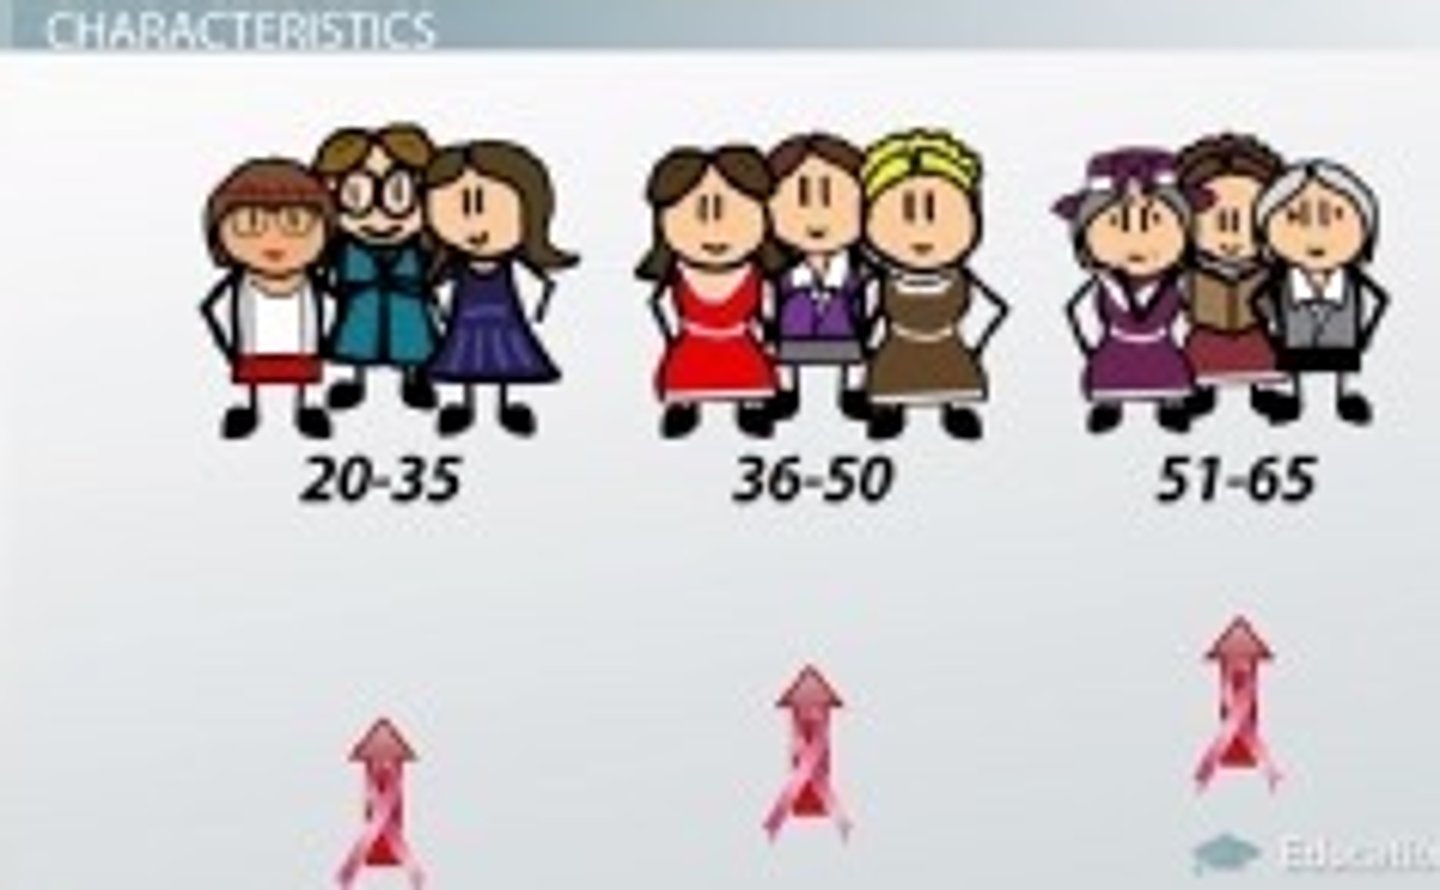
cross-sectional study
a study in which people of different ages are compared with one another
longitudinal study
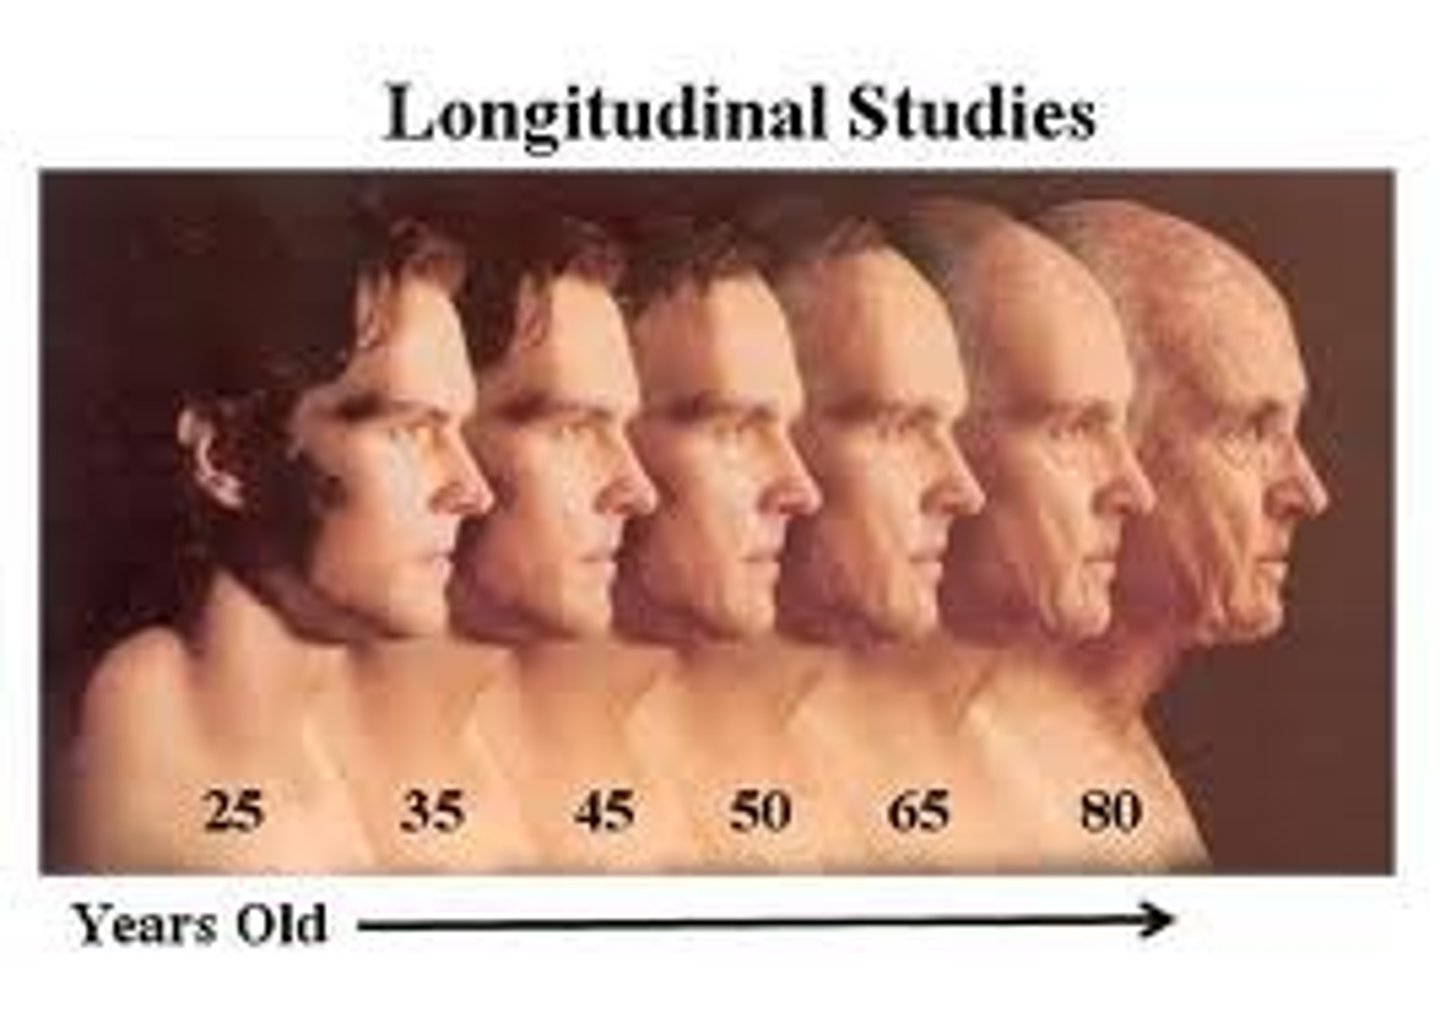
research in which the same people are restudied and retested over a long period