ECON 2105 Midterm ch 4-6 Ward
 Call Kai
 Learn
Learn Practice Test
 Spaced Repetition
 Match
Match Flashcards
 Knowt Play
1/92

There's no tags or description
Looks like no tags are added yet.
Name | Mastery | Learn | Test | Matching | Spaced | Call with Kai | Chat |
|---|
No analytics yet
Send a link to your students to track their progress
93 Terms
GDP (Gross Domestic Product)
Market value of the final goods and services produced within a country in a given time period
most common way of measuring how productive a country is and therefore how wealthy it is.
Market values
the prices at which items are traded in markets (Price1 x Q1) + (P2 x Q2) = total market value
Final Good
an item that is bought by its final user during a specified time period
• Only the value of final goods count toward GDP.
Intermediate good
an item that is produced by one firm, bought by another firm, and used as a component of a final good or service
Produced within a country
(domestic) - goods produced within the US count toward GDP of US or goods produced within Mexico count toward GDP of Mexico
Produced in a given time period
to measure GDP we need to pick a time period and measure goods produced only during that period - either Quarter - year (quarterly GDP) or a year (annual GDP)
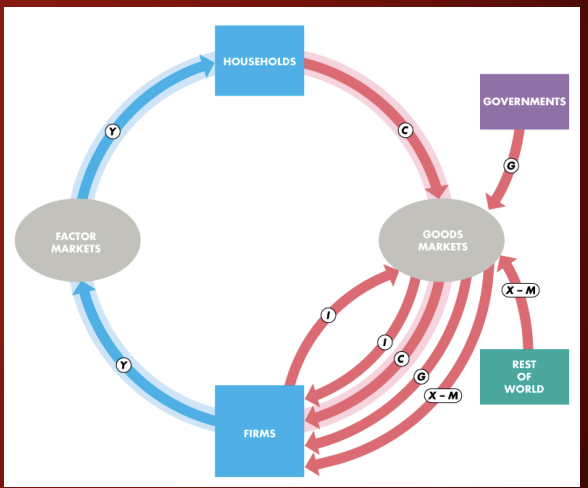
Expenditures
payments that go through goods markets toward firms.
There are 4 types: consumption expenditure, investment, government expenditure, and net exports. (shown in red)

consumption expenditure
payments from households to firms
largest component of GDP
denoted as C

Investment
payments from firms to firms
example: UPS buys a new delivery van
denoted as I

Depreciation
is the decrease in the value of a firm’s capital that results from wear and tear and obsolescence.
due to depreciation, there are 2 different ways to measure investment (net and gross investment)
Gross investment
is the total amount spent on both new capital and replacement capital
Net investment
is the increase in the value of capital.
Gross investment - Depreciation = Net investment
Government Expenditure
Payments from governments to firms
include purchases that gov makes (roads, tanks, buildings)
! does not include taxes
denoted as G

Net exports
Payments from the rest of the world to US firms
net exports = X (exports) - M (imports)

Exports
are the things we sell to the rest of the world.
denoted as X

Imports
are the things we buy from the rest of the world
denoted as M
Export MORE than we import
net exports are positive
payments flowing into the US overall
Export LESS than we import
Net exports are negative
payments are flowing out of the US overall
income
Payment flows from firms through factor markets to households
most income is wages
denoted as Y

Two ways to measure the value of everything produced
1. Add up all the payments for the final goods “Expenditure approach”
2. Add up all the income that households get from producing those goods “Income approach”
Aggregate expenditure =
C + I + G + X – M ( consumption expenditure + investment + government expenditure + exports - imports)
Aggregate Income =
Y (income)
GDP =
Y = C + I + G + X - M ( Aggregate income = Aggregate expenditure)
meaning - GDP = Aggregate expenditure = Aggregate Income or vice versa
Nominal GDP
is the value of final goods and services produced in a given year when valued at the prices of THAT year
Real GDP
is the value of final goods and services produced in a given year when valued at the prices of a reference BASE year
tracks the changes in total production of an entire country over time
Real GDP per person =
Real GDP / population
Potential GDP
The highest level of GDP that is sustainable in the long run, given the factors of production that are available.
the maximum level of real GDP that can be produced while avoiding shortages of labor, capital, land, and entrepreneurial ability that would bring rising inflation
Fluctuations follow a common pattern called
the business cycle
The Business Cycle pattern
1. Expansion: Real GDP increases
2. Peak: Real GDP hits a temporary high point!
3. Recession: Real GDP decreases
4. Trough: Real GDP reaches a temporary low point
Then we start over again with expansion.
Expansions are usually bigger and longer than recessions, so real GDP grows over time.
remember! expansion > peak > recession > trough
Business cycle’s timing is
not predictable
Household production
Productive activities that are never traded on the market
not counted in GDP
Result: GDP underestimates total production
Underground economic activity
Goods and services that are paid for but that aren’t observed by the government
Leisure
Activities that people do for fun, rather than to produce something
Does not count toward real GDP
A country where people vacation a lot will probably have LOWER GDP
Environmental Quality
clean air, clean water, etc is valuable but does not factor into real GDP.
expenditure approach to measuring GDP
The expenditure approach to measuring GDP sums together consumption expenditure, investment, government expenditure on goods and services, and net exports
The largest component in expenditure approach
consumption expenditure
income approach
we sum together compensation of employees, other factor incomes, indirect taxes less subsidies, and depreciation
hyperinflation
an inflation rate of 50 percent a month or higher that grinds the economy to a halt and causes a society to collapse
inflation ≥ 50 percent a month
Consumer Price Index (CPI)
An index that measures the average of prices paid by urban consumers for a fixed basket of consumer goods and services
The CPI is designed to compare current prices to average prices from a specified date in the past.
CPI =
Cost of CPI basket at current prices × 100
Cost of CPI basket at base period prices
CPI inflation rate
measures the percentage change in the price level of a basket of consumer goods and services over time, reflecting the cost of living and inflation trends
CPI inflation rate =
CPI this year – CPI last year × 100
CPI last year
core inflation rate
the rate increase in the Personal Consumption Expenditures Price Index (PCEPI) excluding food and fuel.
serves as a crucial operational guide for the Federal Reserve in assessing inflation trends
real wage rate =
nominal wage x 100
price level
unemployment rate =
Number of people unemployed × 100
Number of people in the labor force
labor force =
[Number of people employed] + [Number of people unemployed]
employment to population ratio =
Number of people employed × 100
Working age population
labor force participation rate =
Labor force × 100
Working age population
discouraged worker
A marginally attached worker who has stopped looking for a job because of repeated failure to find one
frictional unemployment
The portion of unemployment that comes from normal labor turnover
finding a first job
Switching jobs
Someone retires and someone else takes their place
Structural unemployment
the portion of unemployment that’s due to changes in the skills needed to perform jobs or changes in the locations of jobs.
usually lasts longer than frictional unemployment
cyclical unemployment
The changes in unemployment due to fluctuations in the business cycle
During an expansion, cyclical unemployment shrinks.
During a recession, cyclical unemployment grows.
out put gap
difference between real GDP and potential GDP
price level
average level of prices for all goods
inflation
a persistently rising price level
deflation
A persistently falling price level
What do unexpected inflation and deflation do?
redistribute wealth
lower real gdp and employment
divert resources away from production
unexpected inflation >
borrower wins
unexpected deflation >
lender wins
majority of US income is?
wages
working age population
the total population but the people under 16 or living in an an “institution” (hospital, jail, nursing facility, etc.)
labor force
people who can work and are either working or trying to find work
unemployed
those who are in the labor force but do not have a job
growth rate in xx =
Value of XX in current year − Value of XX in previous year x 100
Value of XX in previous year
growth rate in real GDP =
Real GDP in current year − Real GDP in previous year × 100
Real GDP in previous year
Real GDP tells us
how productive the entire country is
Real GDP per person tells us
how high the average standard of living is
growth rate of real GDP per person =
Growth rate of real GDP – Growth rate of population
Economic growth
The expansion of production possibilities
Rule of 70
A rule that states that the number of years it takes for the level of any variable to double is approximately 70 divided by the annual percentage growth rate of the variable.
If a variable grows at X% each year, it will take about 70/X years for the variable to double.
Aggregate Production Function
X-axis: Quantity of labor (hours per year)
• Y-axis: Real GDP
• “If people in this economy work a total of X hours this year, what will be the resulting value Y of real GDP?”
• More labor hours → More real GDP
Aggregate Labor Market
Just a graph of the supply and demand for labor.
• X-axis: Quantity of labor (hours per year) in total for the country
• Y-axis: Price of one hour of labor (“real wage rate”)
when we are at full employment, then
real GDP = potential GDP
two key forces that can make potential GDP grow
growth of supply of labor
growth of labor productivity
quantity of labor
total number of hours worked in the economy
quantity of labor changes if any of these changes:
Average hours per worker
Employment-to-population ratio
Working-age population
to illustrate an INCREASE in the supply of labor,
we go to the aggregate labor market graph, and shift the labor supply curve to the right
labor productivity =
Real GDP / total labor hours
if a country wants to have labor productivity growth, it needs 4 preconditions
firms
markets
property rights
money
once a country has preconditions to grow labor productivity, the pace of growth depends on THREE variables
1. Physical capital growth (more machines and tools)
2. Human capital growth (more knowledge and expertise)
3. Technological advances (better ideas and new ways of doing things)
which of the three variables has made the greatest contribution to labor productivity growth?
Technological change
classical growth theory
a theory of economic growth based on the view that the growth of real GDP per person is temporary and that when it rises above subsistence level, a population explosion eventually brings it back to subsistence level
Thomas Malthus created it so it is also called Malthusian Theory
neoclassical growth theory
a theory of economic growth that proposed that real gdp per person grows because technological change induces an amount of saving and investment that makes capital per hour of labor grow
new growth theory
a theory of economic growth based on the idea that real GDP per person grows because of the choices that people make in the pursuit of profit and that growth will persist indefinitely.
growth rate
is the annual percentage change of a variable - the change in the level expressed as a percentage of the initial level
Growth rate of population
Population in current year − Population in previous year × 100
Population in previous year
Why does GDP equal aggregate income and also equal aggregate expenditure?
GDP equals aggregate income and also equals aggregate expenditure because _______.
firms pay out as incomes (aggregate income) everything they receive from the sale of their output (aggregate expenditure)
An intermediate good is _______.
An example of an intermediate good is _______.
an item that is produced by one firm, bought by another firm, and used as a component of a final good or service
wheat sold to a baker to make bread
A final good is _______.
An example of a final good is _______.
an item that is bought by its final user during a specified time period
bread sold to a consumer
The firm that printed your textbook bought the paper from XYZ Paper Mills.
Was this purchase of paper part of GDP? If not, how does the value of the paper get counted in GDP?
This purchase of paper _______ part of GDP because the paper is _______ good.
is not; an intermediate
The value of the paper is counted in GDP as _______.
part of the value of the textbook
Question content area
Part 1
Classify each of the following items as a final good or service or an intermediate good or service and identify which is a component of consumption expenditure, investment, or government expenditure on goods and services:
Item 1. Cheese bought by Domino's
Item 2. The purchase of a new security system for Congress
Item 3. The ringtone you bought today
Item 4. A new apartment building
Item 1 is _______ and item 2 is _______.
an intermediate good;
a final good which is government expenditure
Classify each of the following items as a final good or service or an intermediate good or service and identify which is a component of consumption expenditure, investment, or government expenditure on goods and services:
Item 1. Cheese bought by Domino's
Item 2. The purchase of a new security system for Congress
Item 3. The ringtone you bought today
Item 4. A new apartment building
Item 3 is _______ and item 4 is _______.
a final good that is consumption expenditure;
a final good that is investment