Threats to Freshwater Resources
 Call Kai
 Learn
 Practice Test
 Spaced Repetition
 Match
 Flashcards
 Knowt Play
1/28

There's no tags or description
Looks like no tags are added yet.
29 Terms
3 Examples where there is threat to water resources Vancouver
Capilano Creek, Carnation Ck, Coquihalla R

At Carnation Creek, what has happened with water availability?
Rainfall Dominated
There is high rainfall during autumn and winter and no water flow during the summer

At Coquihalla R, what has happened with water availability?
Snow dominated
80’s the highest rainfalls where during mid winter, then in spring summer there was snowmelt, however, water flow started increasing during the winter

Capilano Creek, what has happened with water availability?
Hybrid
beginning of the 80s: flashy response to winter rain but low flows during the summer/early autumn,
Enhanced summer flows due to snowmelt from higher elevations.

Climate Change and Hydrology
DIRECT EFFECTS
Changes in precipitation
Changes in air temp
Climate Change and Hydrology
INDIRECT EFFECTS
Changes in glacier extents
Changes in vegetation patterns
Changes in consumption by people
Climate Change and Hydrology
Can we predict what will happen locally?
Downscaling from global climate models to regional scenarios:
A range of approaches, including
Statistical downscaling
Regional climate models (RCMs)
→ A source of uncertainty
Climate Change and Hydrology
On what is the magnitud of the warming dependent?
dependent on location
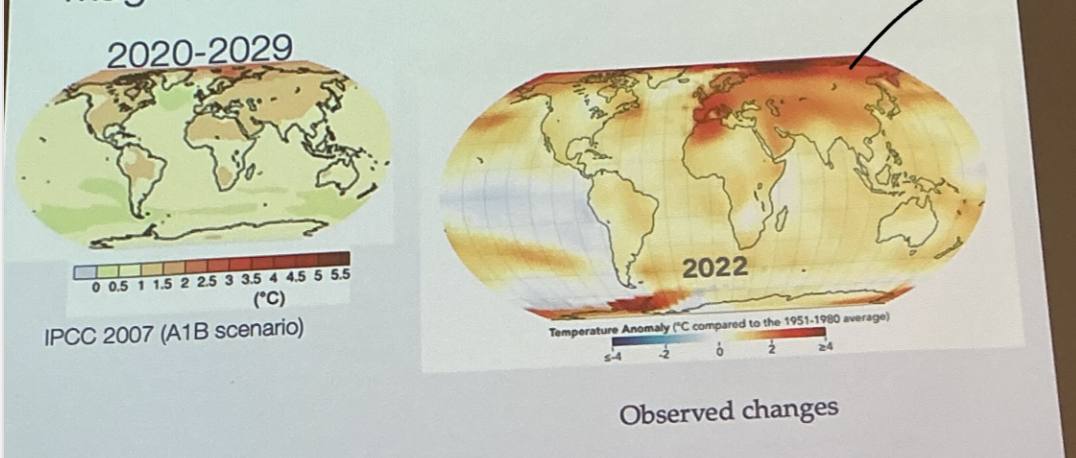
Climate Change and Hydrology
What is happening on this map?
ice is warming
reflection is not happening the same way…less albedo
loose sea ice, water absorbs solar radiation
Climate Change - mean state and variability
What is looked after in the Holocene?
→stability
→ seasonal predictibility and relationships, now we are changing to unpredictibility
Conditions are changing→ diversity for resilience, HOWEVER: reductions in diversity, so not that variable anymore
Climate Change - mean state and variability
Increase in mean

Climate Change - mean state and variability
Increase in variance

Climate Change - mean state and variability
Increase in mean and variance

Stress to Freshwater Availability
The global picture:
Projected mean change in annual freshwater runoff in the next century

Future air temp and precipitation scenarios for British Columbia 2041-2070
Annual mean temp . is going to increase specially in the northern part as well as precipitation.

Climate Change projections for southern BC 2020-2050
2020
temp:
→ winter: increase
→ summer increase 0.5 - 2
precipitation;
→winter: increase -5 to +15
→ Summer: -30 to +5

Climate Change projections for southern BC 2020-2050
2050
temp:
→ winter: increase 1.5 to 3.5
→ summer increase 1.5 - 4
precipitation;
→winter: increase 0 to 20
→ Summer: -35 to 0
Climate Change projections for southern BC 2020-2050 PROJECTIONS
BC→more rain instead of snow → need for larger reservoir → costs → current reservoir is at capacity
the increases in precipitation are happening when we don’t need them
Demand and access during the summer is also going to change
Climate Change projections for southern BC 2020-2050 SUMMARY OF CLIMATE PROJECTIONS
Increased water temps
longer summer dry spells
changing precipitation patters
sea level rise
air quality
CLIMATE PROJECTIONS & IMPACTS IN BC
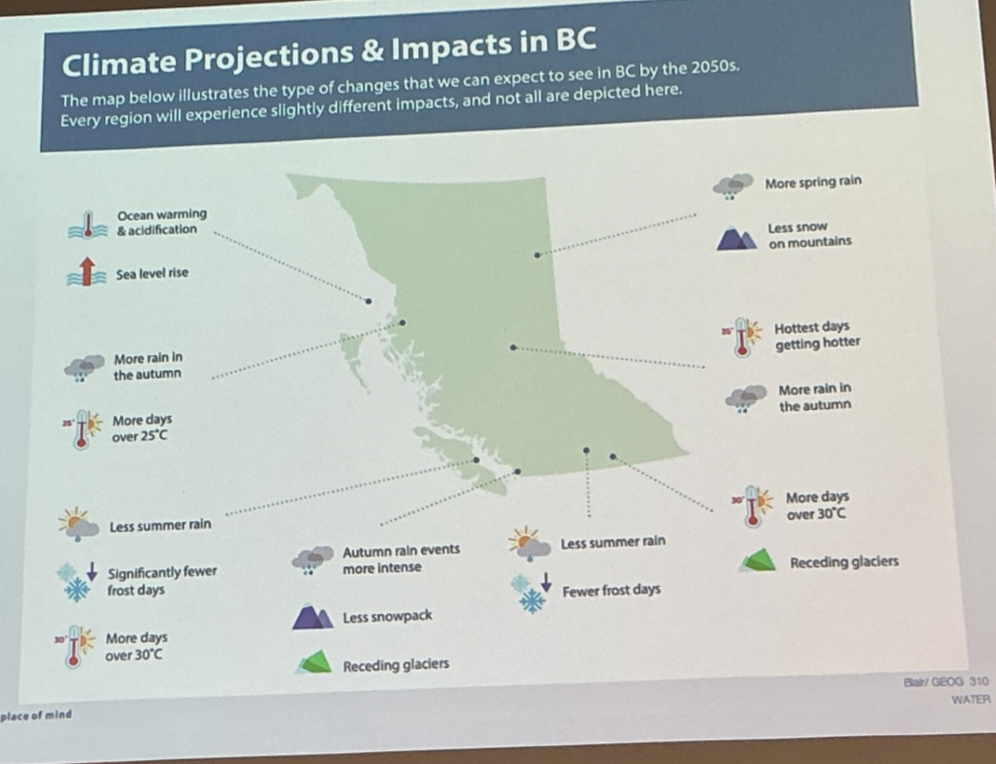
How might streamflow in rain-dominated catchment in south coastal BC be affected by climate change?
Less snow, earlier melt, longer season of low precipitation

How might streamflow in snow-dominated catchment in south coastal BC be affected by climate change?
Infrastructure needs to be adapted → this takes time and resources→ adopt diff. water utilizations in the meantime
Impacts on Communities, Economy, Health and Wellbeing
Hotter drier summers
Increased wildfire and smoke
longer growing season
heatwave
water scarcity
drought
decline of traditional foods
Impacts on Communities, Economy, Health and Wellbeing
Rising sea levels and ocean warming
coastal flooding
storm surges
evacuation, relocation
loss of marine species
impacts on fishing coastal communities
Impacts on Communities, Economy, Health and Wellbeing
Warmer, wetter winters
flood risk
extreme storm events
infrastructure damage
shifting ecosystems
significant impacts to cultural sites
Streamflow response to warming in glacier-fed catchments
first phase (rising flows)
→ earlier disappearance of snow cover, increased melt due to exposed glacier ice and longer melt season-lack of snowfall - glaciers not covered
Surface influences on meltwater production:
effect on snow vs glacier ice
Low winter snow → warmer summers
More sinter snow → cooler summers

Streamflow response to climate warming in glacier-fed catchments: conceptual model
Phase 1 = Onset of warming and shift to negative net balance (melt > accumulation)
Phase 2 prediction = reduction of streamflow

Why are quantitative projections of future snowmelt and glacier runoff uncertain?
Although we understand the general direction of changes, exact predictions are uncertain because of uncertainty in future climate, downscaling methods, and limitations of simulation models.
Qualitative: We understand generally how snowmelt and glacier runoff will change.
Quantitative: We are less certain about the exact amounts and timing.