BMGT 394H #4: Classification models
 Call Kai
 Learn
 Practice Test
 Spaced Repetition
 Match
 Flashcards
 Knowt Play
1/33

There's no tags or description
Looks like no tags are added yet.
34 Terms
classification
predicts which class (category) a record belongs to
why not just use linear regression?
logistic regression instead fits an s-shaped curve that is always between 0 and 1, which better matches how probabilities behave
a logit of 0 represents
even odds (p = 0.5)
implementation for classification
estimate the probability of belonging to a class
use a cutoff value on that probability to classify records
the cutoff determines the sensitivity and specificity of the classifier, which is visualized by the ROC curve
β
the change in log odds of yes for a one-unit increase in x, holding others fixed; positive raises probability of x, negative lowers it
maximum likelihood estimation
finds parameter values that maimize likelihood that the model produced the actual data observed
odds ratio (e^B)
each additional variable increases odds by a multiplier of odds ratio
confusion matrix
actual vs predicted
accuracy
what share of all predictions were correct?
= TP + TN / total
sensitivity (aka recall, TPR)
TPR; of the actual positives, how many did we catch?
TP / (TP + FN)
specificity
TNR; of the actual negatives, how many did we correctly reject?
TN / (TN + FP)
precision
of the ones we flagged positive, how many really were?
TP / (TP + FP)
false positive rate
of the actual negatives, how many did we wrongly flag?
F1 score
one number balancing precision and recall
sckit-learn’s classifcation_report shows
precision, recall, and F1 for each class + support (number of actual records)
lower cutoff →
more recrods predicted “yes” → catch more true positives (increases sensitivity), but decreases precision and specificity
higher cutoff →
opposite of low cutoff
ROC curve
plots true positive rate (sensitivity) on y-axis vs. false positive rate (1-specificity) on x-axis
optimal cutoff from ROC
maximizes sensitivity + specificity TPR + (1-FPR)
corner point of the curve (top left)
gain and lift chart
if i can only contact the top x%, how many postiives will i reach?
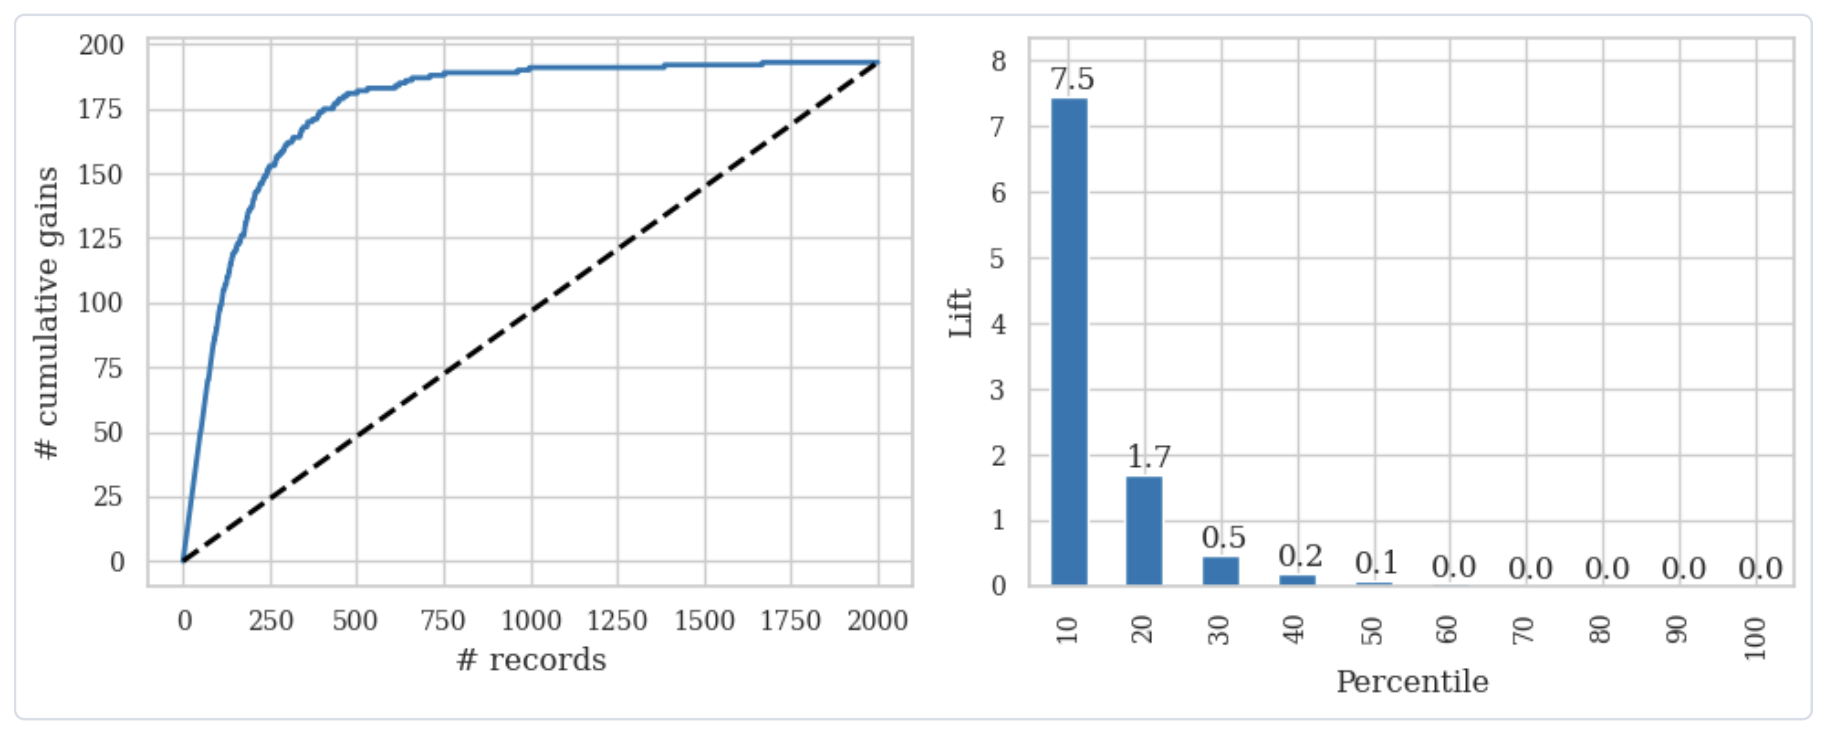
gain
total number of cases of interest identified by model as you go down the sorted list
lift
ratio of cases found by the model to cases found by random selection
% of positives in decile / % of positives overall
a good model has __ lift in first deciles
high
validation
testing on data the model hasn’t seen
in a gains chart, is a steep rise at the start good or bad?
good; it means the model put the real yess at the top
t/f: the bigger the gap between the diagonal and the curve, the better the model
true
con of validation set approach
results depend on which rowrs landed where, less data for training
k-fold cross validation
split k into equal folds, train on k-1 and validate on the remaining ones; repeat k times so each fold is the validation fold once, average the k scores
LOOCV
train on all records but one, test on that one, repeat n times
when do you split data?
when you want to predict, not explore. splitting for exploratory misses out on a lot of data
when the class you care about is rare, judge the model by __ instead of __
precision; accuracy
missing a disease is very costly, so you should favor
recall
missing a real email is costly, so favor
precision
should you lower or raise the cutoff?

lower; recall suffers because most customers have predicted probabilities closer to 0