Global Economics Midterm 2
 Call Kai
 Learn
 Practice Test
 Spaced Repetition
 Match
 Flashcards
 Knowt Play
1/23

Earn XP
Description and Tags
Includes Phillips Curve, Aggregate Demand/Supply/and Equilibrium, Monetary Policy, and Fiscal Policy
24 Terms
Phillips Curve
A model that illustrates the inverse relationship between inflation and unemployment, suggesting that lower unemployment can lead to higher inflation.
Drivers of Inflation
Factors that contribute to rising prices in an economy, including demand-pull factors, cost-push factors, and built-in inflation.
Demand pull forces
A driver of inflation. These occur when demand for goods and services exceeds supply, often due to increased consumer spending, government expenditure, or investment.
Forces include:
Increased income - Fiscal policies that transfer money to households may lead to demand pull forces. the larger income will lead to more demands.
Redistributive policy - Rich people being taxed gets redistributed to the poor leading to poorer people consuming more leading demand consumption, goods go up.
Supply shocks and cost push forces
Driver of inflation. Supply chain disruption. Changes in input costs for firms as a result of the pandemic. It became more costly to produce and sell. Oil and Gas for example became very expensive to transport.
Drivers of inflation
Demand pull forces
Supply shocks and cost push forces
Increased money supply (Monetary policy)
Combination of labor market conditions and inflation expectations (Phillips curve)
Wage setting condition

What are the variable and the relationships between them in the wage setting condition?
P^e is the expected consumption prices during the contract
u is the unemployment rate
z is labor market policy generosity levels - Union protections or policies that give workers greater bargaining power over wages.
How does u effect w? How does it effect function f(u,z)?
If unemployment is high, that means there are a lot of job seekers in the market; therefore, job seekers dont have wage bargaining power.
u negatively impacts f(u,z) as unemployment goes up.
Price markup rule

In the price markup rule what influences m?
Market structure - US markets are competitive due to the number of substitutes, but over time there has been a lot of a shift in power due to the number of mergers.
Antitrust regulations
Trade policy
Graphical representation of the natural rate of employment.

Graphical representation of the natural rate of employment. Increase in z.

Graphical representation of the natural rate of employment. M shrinks.

Phillips Curve Relationship Expression
Real inflation rates are negatively related to unemployment rates.
When unemployment falls inflation goes up.
When unemployment rises inflation decreases.

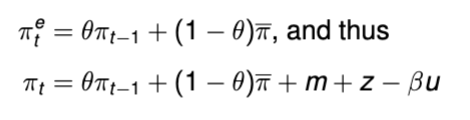
Inflation expectation anchoring vs. persistence; meaning of θ
Pie bar is the anchored inflation rate. and theta represents the anchored inflation value and if it is large than years inflation rate then it plays a significant role in determining this years inflation rate.
Business cycles