Portfolio Theory
 Call Kai
 Learn
 Practice Test
 Spaced Repetition
 Match
 Flashcards
 Knowt Play
1/23

There's no tags or description
Looks like no tags are added yet.
24 Terms
What are the characteristics of returns?
Expected return E (r) - This is the average annual return on an investment over a period of time.
Standard deviation of returns 𝝈 - This is the amount that the investment’s returns varies around the average
Covariance/correlation of returns - Measures how close two different returns move together eg positive covariance means they move together.
What is the theoretical approach in risk and return?
Base returns off future scenarios, different states of the world. They estimate the probabilities of these events occurring and go off that for their investment.
What is the historical approach in risk and return?
Analyse historical time periods daily, weekly, monthly, annually etc of numerical returns.
Then use arithmetic averages of the historical returns to then make investments.
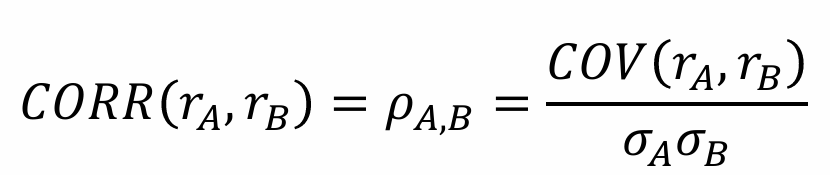
Correlation coefficient and formula
Coefficient measures the degree of correlation between two different returns
Between -1 and 1, -1 being negative, 1 being positive and 0 being uncorrelated
Expected return of a portfolio
We use the weighted average of the expected averages.
We multiply the proportion invested in the share by the expected return of the share. We sum all of these depending on how many securities there are.
Standard deviation of a portfolio
The risk of a portfolio is different to that of a the expected return where you simply sum.
The risk depends on:
Individual standard deviation of each security
Covariance of securities
Proportion of each security invested into
what is an investors preference in risk and return, and the trade off?
investors prefer higher returns, while being risk averse meaning having lower risk.
The trade off is that for a higher return there is a higher risk associated.
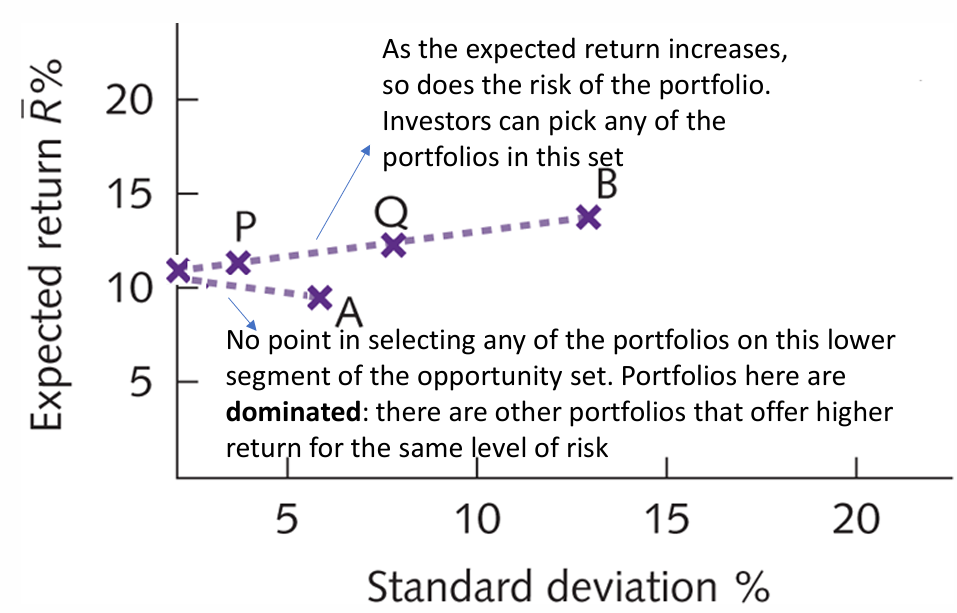
What does it mean when a portfolio is dominated?
If a portfolio has:
has the same return and either and equal or lower risk
And performs better in at least one dimension
Then it dominates the other portfolio.
What is an opportunity set?
Securities can be combined with different proportions creating different portfolios.
These different portfolios collated together is an opportunity set.
What is the efficient frontier?
The portfolios that remain when the portfolios that are dominated are removed.
These portfolios offer the highest returns respective of their distinct risk
Expected returns of two-securities portfolio
Is simply the sum of expected return of each individual security multiplied by the proportion of the amount invested.
wa and wb must equate to 1.

Perfectly correlated two securities (+1)
When perfectly correlated, the two securities moved perfectly together.
The portfolio’s SD simply becomes the weighted average of the securities’ averages.
Note that when correlation is +1, there is no benefit of diversification.

Positive correlation portfolio graph
y axis is expected return and x axis is SD (risk)
Along the line can make up different combos of A and B hence all portfolios are along the line A to b (the opportunity set)
As the portfolios move perfectly, then no one dominates the other hence the opportunity set is also the efficient frontier

Perfectly negative correlated two-securities (-1)
Where returns of the two securities move perfectly in opposite directions
It is the difference between the two weighted standard deviations
Importantly, it means one security can offset the others losses

Eliminating risk through diversification
You can choose the amount of proportion of investment in each security using this equation
The remaining proportion after A is put into B making the the total standard deviation 0, hence offering constant returns

perfectly negative correlation graph
The portfolio on the vertical axis has an SD of zero, making it a risk free portfolio
From the risk free portfolio to B is the efficient frontier offering a higher return when increasing risk
The lower segment is portfolios that are dominated as the other portfolios above offer a higher return with same risk