P Values and Comparing Groups
 Call Kai
 Learn
 Practice Test
 Spaced Repetition
 Match
 Flashcards
 Knowt Play
1/38

There's no tags or description
Looks like no tags are added yet.
39 Terms
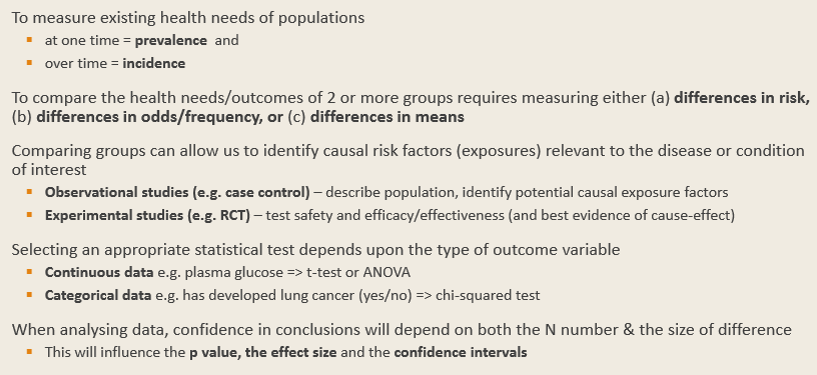
Why compare the HEALTH of groups?

Compare the health of 2* Groups? One time-point per pateint - CROSS-SECTIONAL STUDY
Cross-sectional study —→ One time point. One group surveyed to test associations between exposures and outcome/s
Make 2 measurements per person: amount of cause vs amount of effect
Measurements: predictor vs. outcome
Compare the health of 2* Groups? One time-point per pateint - ECOLOGICAL STUDY
Ecological study —→ community/population observed to test associations between exposures and outcome/s
Compare the health of 2* Groups? One time-point per pateint
Both studies focus on simultaneous observation of exposure and outcome, but difference is unit of observation
1) Cross-sectional study – focus on individual/patient level data
2) Ecological study – focus on population-level data (e.g. by country)
Compare the health of 2* groups? Two or more time-points per patient - COHORT STUDY
Cohort study —→ Prospective. 2+ time points. Start disease-free participants followed up to see if they develop a disease (condition/outcome) of interest
Usually with groups who differ at outset on some exposure/s of interest
Compare the health of 2* groups? Two or more time-points per patient - CASE-CONTROL STUDY

Compare the health of 2* groups? Two or more time-points per patient - RANDOMISED CONTROLLED TRIAL
Randomised controlled trial (RCT) —→ Prospective. 2+ time points. groups who are randomly allocated to receive intervention(s) versus comparator(s)
Test safety and efficacy/effectiveness of interventions
Example: Ronald Fisher’s fields to test efficacy of manures
Risk VS Odds: Smoking —→ Lung Cancer
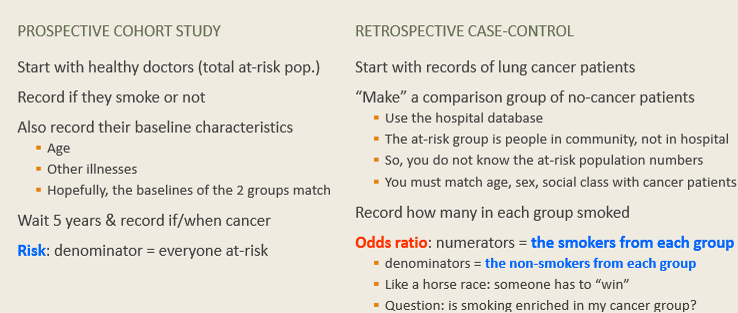
What are the STRENGHTS of Case-Control Studies?
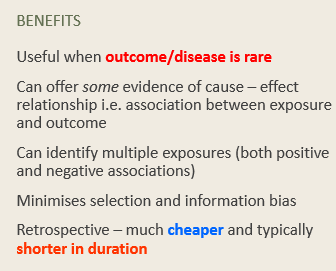
What are the WEAKNESSES of Case-Control Studies?

What is RANDOMISED CONTROLLED TRIAL?

Why and When are RCTs conducted?

What are the STRENGHTS of RCTs?
1) Minimise selection bias
2) Minimise measurement bias
3) Best single-study evidence for causal association between exposure (intervention) and outcome
What are the WEAKNESSES of RCTs?
1) Time-consuming
2) Difficult
3) Expensive
4) Researchers can over-rely on them
What is the GOAL of Statistical Testing?

What is a VARIABLE?
Variable = A parameter that you can or will measure/observe, which varies in your cohort
§Height, plasma glucose, eye colour, alive or dead (“living status”), treated or untreated
Variables - OUTCOME VARIABLE
An outcome variable is the variable that supposedly results from other inputs. It occurs later.
What you think is “the effect that resulted from what you did”
Also called the dependent variable
Variables - PREDICTOR VARIABLE

Variables - CONFOUNDING VARIABLE
Another (unwanted & unmeasured) variable or fact that is messing up your ability to correctly reach a conclusion
Variables - CONTINOUS VARIABLE
A continuous variable is a number that can go through many values and fractions: height, age
Variables - BINARY or DICHOTOMOUS VARIABLES

Variables - ORDINAL VARIABLES

Why are Statistical Tests used?

What is the CHI SQUARED TEST?

What is the difference between TYPE 1 and TYPE 2 ERROR?

Errors Bsed on Your Data: Type I VS Type II
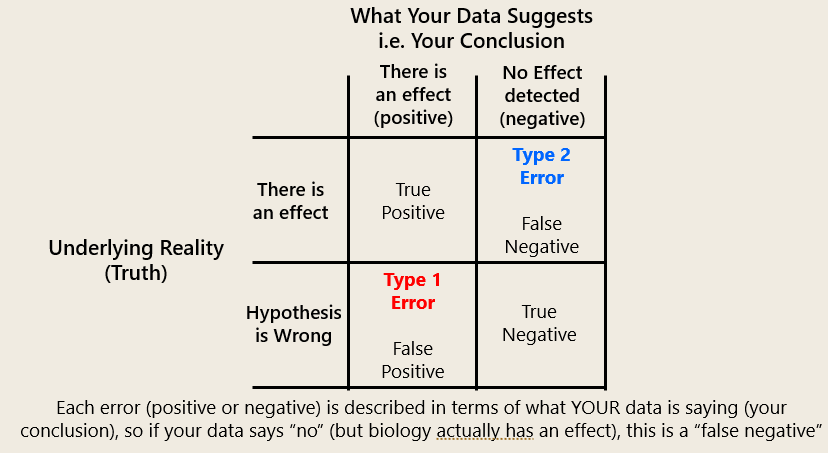
What is the T-TEST?

What does T-Test COMPARE?

What is the P VALUE?
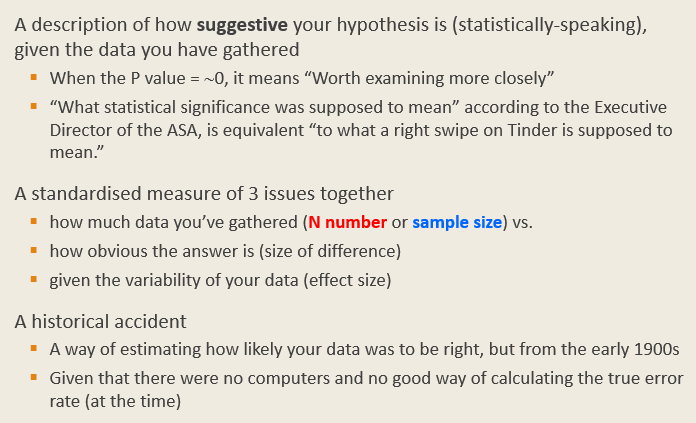
P Value: What You Want VS What You Get
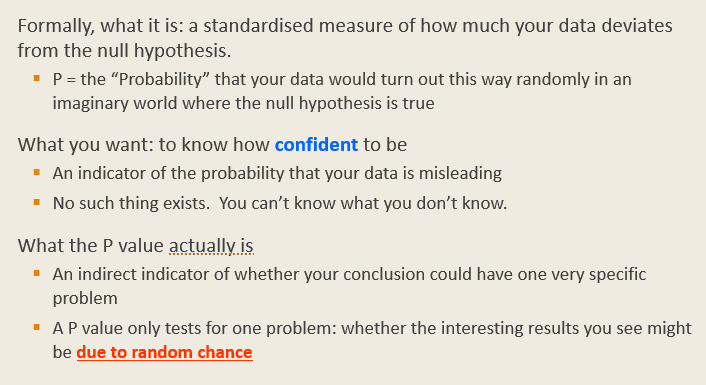
Why are SMALL VALUES of P GOOD?

P Values: Example Comparing Two Randomly Generated Groups

What is the NULL HYPOTHESIS?

What is the EFFECT SIZE?
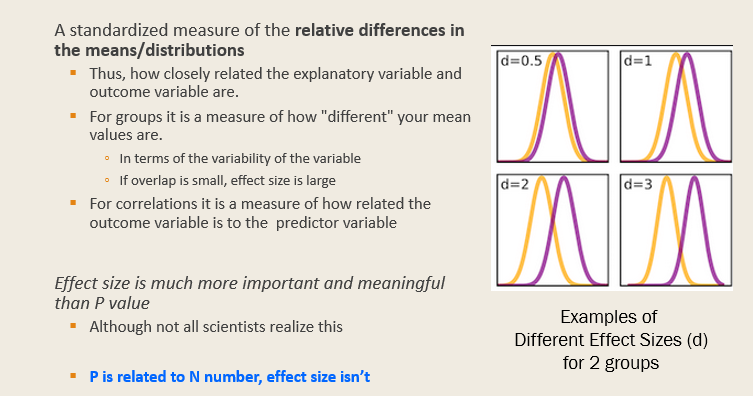
Effect Size: Cohen’s ‘d’

P Values VS Effect Size
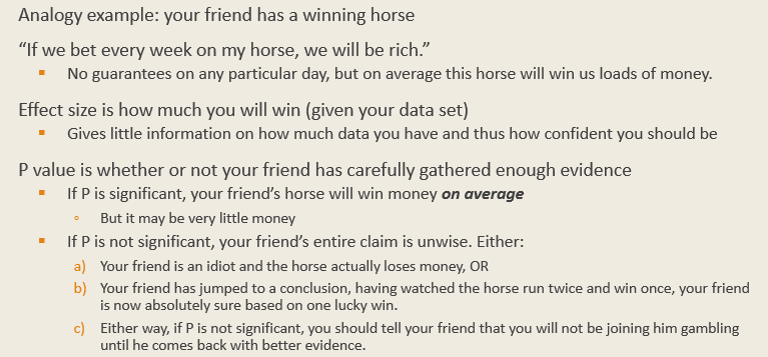
What are CONFIDENCE INTERVALS (CI)

How do you compare HEALTH OUTCOMES?

Summary