introduction to study design: cross-sectional studies
 Call Kai
 Learn
 Practice Test
 Spaced Repetition
 Match
 Flashcards
 Knowt Play
1/15

There's no tags or description
Looks like no tags are added yet.
16 Terms
why is this topic important?
The epidemiological triad:
• Example ofTaenia solium lifecycle
• Human – pig – human cycle
• Human – Human cycle
• What hosts are important in Taenia solium lifecycle?
• LIST factors that may be associated with “disease” in these
hosts
• For each factor, note if is related to the Host, Agent, or
Environment
• How do we generate credible evidence to support the
assertations that factor x may be associated with
‘disease’?

classification of study types

observational studies
•Descriptive studies
•Analytical studies
descriptive studies
Descriptive studies
tend not to be
hypothesis driven;
however, a clear
objective must be
stated.
Not designed to
evaluate any
associations
between
exposures and
outcomes of
interest.
Observations
made in a
descriptive study
can form the basis
of hypotheses
which then are
further investigated
in analytic studies

analytical studies
Differ from descriptive studies in
that the comparison of 2 or more
groups is the central foundation
of their design.
Differ from experimental
studies/controlled trials in that the
researcher has no control over
the allocation of the study
subjects to the groups being
compared.
A N A LY T I C A L S T U D I E S : E X A M P L E S
• Cross-sectional
Measurements on exposure and outcome are performed
at a defined single point in time - meaning exposure and
outcome are not known before the study starts.
• Cohort
• Case-Control
P R O S P E C T I V E O R R E T R O S P E C T I V E S T U D I E S


I N T E R V E N T I O N S T U D I E S :
C O N T R O L L E D T R I A L S / E X P E R I M E N T A L S T U D I Es
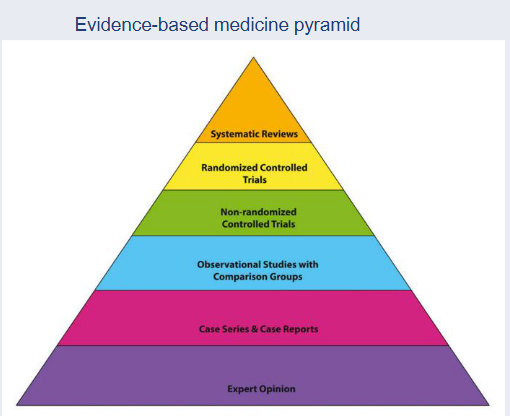
S t u d y d e s i g n s : l e v e l s o f e v i d e n c e
From bottom to top, reflects the
quality of research designs
(increasing) and quantity
(decreasing) of each study design
in the body of published literature
Why are controlled
studies positioned above
observational studies?
cross sectional studies
Key considerations
• Background
• Study objective
• Study population
Inclusion and exclusion criteria
• Sample size
• Exposure and disease
• Analysis

key characteristics of cross sectional study
Key characteristics
• Measurements on exposure and
outcome are performed at a defined
single point.
• Groups determined based on exposure
and outcome.
• Main comparison is prevalence of the
outcome in the exposed and non-
exposed animals/subjects
• Measures of association: Prevalence
risk ratio, Odds ratios
• Without follow-up

cross-sectional study prevalence
Prevalence is the proportion of the population that are cases at a given point in time:
Prevalence = No. test positive / No. test positive + no. test negative
Point prevalence
• Numerator - Number of current cases (new and pre-existing) at a specified
point in time.
• Denominator - Population at the same specified point in time.
Period prevalence
• Numerator - Number of current cases (new and pre-existing) over a specified period.
• Denominator - Average or mid-interval population.


calculate prevalence: example 2 - salmonella
In an EU baseline survey, 454 GB poultry layer holdings were sampled for Salmonella. Fifty-four holdings tested positive for Salmonella spp.
• What was the prevalence of Salmonella spp. on the poultry layer holdings?
The investigators were particularly interested in the presence of Salmonella spp of public health importance (S. Enteritidis and S. Typhimurium). Six holdings were positive for S. Enteritidis and 30 were positive for S. Typhimurium.
• What was the prevalence of each serovar on the poultry layer holdings?
In an EU baseline survey, 454 GB poultry layer holdings were sampled for
Salmonella. Fifty-four holdings tested positive for any Salmonella spp.
• What was the prevalence of Salmonella spp. on poultry layer holdings? 54/454 = 12%
The investigators were particularly interested in the presence of Salmonella of public health importance. Six holdings were positive for S. Enteritidis and 30 were positive for S. Typhimurium.
• What was the prevalence of each serovar?
S. Enteritidis: 6/454 = 1.3%
S. Typhimurium: 30/454 = 6.6%

analysis: measures of association
Compare exposed and unexposed groups
• Prevalence risk ratio - compare prevalence of the outcome or
disease frequency in exposed group and non-exposed group.
• Magnitude of association between a potential risk factor and
disease.
Measured using odds ratios.
Provides information about risk factors, but not on absolute risk
interpreting odds ratios
Odds ratio (OR)
• An odds ratio is a relative measure of effect, which allows the
comparison of the exposed group of a study relative to the
comparison or non-exposure group.
• In the example paper, the exposure is treatment with
antimicrobials and outcome is Salmonella shedding
(positive or negative)
• If the outcome (e.g., Salmonella shedding) is the same in both the
exposed (treated with antimicrobials) and non-exposed (not treated)
groups the odds ratio will be 1, which implies there is no difference in
the risk of Salmonella shedding between the two groups.
However:
• If the OR is > 1 the risk of Salmonella shedding is greater in the
exposed group (treated with antimicrobials) compared to the non-
exposed (not treated with antimicrobials).
• If the OR is < 1 the risk of Salmonella shedding is less in the exposed
group (treated with antimicrobials) compared to the non-exposed (not
treated with antimicrobials)

limitations of cross sectional studies
• A count of cases will be of some interest, but unless the size of the population is known, it is of little interest to compare populations.
What factors influence the prevalence of disease?
• Prevalence is a function of both incidence and duration of the disease.
• Difficult to disentangle factors associated with persistence of the outcome (or survival) from factors associated with developing the outcome (i.e. becoming a new case).
Current exposure status may not reflect status at the time disease occurred
– Not an issue with “tombstone” data e.g. breed, sex, genetic characteristic
– May be addressed by measuring past exposure e.g. through questionnaire but beware of recall bias.
Over-represent cases with a long duration of disease
• Consider an exposure which is associated with a mild disease of long duration:
– Prevalence likely to be high
– Measure of association likely to be strong
Under-represent cases with a short duration
• Compared to an exposure associated with rapid mortality:
– Prevalence low
– Measure of association weak or indeterminate
• A disease with a high prevalence is not necessarily more important than a disease with a low
prevalence
summary
Cross-Sectional Studies
• Measurements on exposure and outcome are performed at same
defined single point in time, hence difficult to determine if exposure
preceded disease.
• Main comparison in cross-sectional studies is between the
prevalence of the outcome in the exposed and non-exposed
animals.
• Common measures – prevalence, prevalence risk ratio, and odds
ratios.