AP Statistics Unit 1
 Call Kai
 Learn
Learn Practice Test
 Spaced Repetition
 Match
Match Flashcards
 Knowt Play
1/33

Earn XP
Description and Tags
gambere
Name | Mastery | Learn | Test | Matching | Spaced | Call with Kai | Chat |
|---|
No analytics yet
Send a link to your students to track their progress
34 Terms
Categorial binary
A Qualitative data category that is measured with only two groups. Example: participants in a study who are either male or female.
Categorial nonbinary
A Qualitative data category that is measured with more than 2 distinct groups. Example: Participants’ favorite soccer team.
Quantitative discrete
A Quantitative data category that is measured by counting numeric values, only by taking specific numeric values. Example: Participants' number of soccer goals scored last year.
Quantitative continuous
A Quantitative data category that is measured on a numeric scale. Example: time it takes a participant to run 100 meters.
Positively skewed/skewed right data set
A set of data that is compact towards the lesser values and flattens/spreads out towards the greater values. Mean > Median > Mode.

Negatively skewed/skewed left data set
A set of data that is compact towards the greater values and flattens/spreads out towards the lesser values. Mode > Median > Mean.

Unimodal data set (symetric)
A set of data that has only one “peak” at a certain point, roughly around the median of the data set.

Bimodal data set (symetric)
A set of data that has two “peaks” at opposite points within the data set.

Uniform data set
A set of data which is roughly evenly distributed across all value.

Non-uniform/random data set
a set of data which is randomly distributed across all value with no distinct trends.

Frequency
The amount of times a certain output was observed in a set of data.
Cumulative frequency
The amount of times a certain output was observed in a set of data in addition to all the frequencies of the outputs before it.
Relative frequency
The ratio of the number of times a specific event or value occurs to the total number of outcomes or observations in a dataset. (expressed as a decimal or %)
Cumulative relative frequency
The ratio of the number of times a value occurs to the total number of outcomes or observations in a dataset in addition to all the relative frequencies in the data set before it. (expressed as a decimal or %, and should equal 1 at the end)
Statisticaly significant
The results of a study did not happen by random chance are there for are statisticaly significant.
Parameter/statistic
The parameter is the desired output of a study or experiment over the entire population. A statistic is a set of data taken from a smaller population (sample) used to estimate the parameter.
Under coverage bias
The most common type of bias in which the population selected for the study or experiment fails to represent the whole of the population selected from. Example: a study about employment rates in NYC did not include any people over 45 years old.
Nonresponse bias
Participants in a study or experiment fail or do not comply to complete the tasks that are being measured properly. Example: participants in a study about body weight refused to take off their shoes before stepping on the scale.
Poorly designed questions/tasks bias
In an experiment or study, the tasks or questions are poorly designed which can lead to skewed data sets as false information is likely gathered. Example: many participants in a study were confused on what question 3 meant so they answered untruthfully.
Non-random/convenience bias
Participants for a study or experiment are not chosen at random. Example: The researchers chose the first ten people they found for the experiment, inadvertently leading to all their participants being under 30 years old.
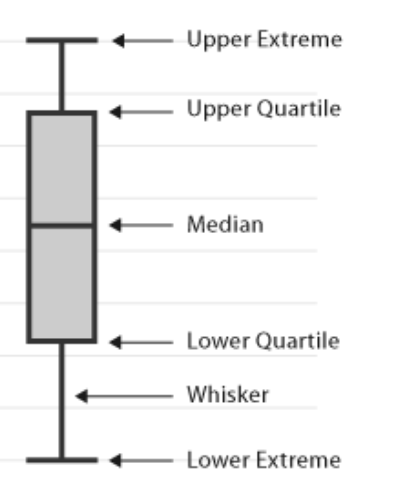
Five number summary
A list of five numbers in a data set that helps show the data more easily.
Minimum
1st quartile (25th percentile)
Median (50th percentile)
3rd quartile (75th percentile)
Maximum
Box plot/box and whiskers graph
A type graph of that shows the five number summary to help display the data more easily.
Interquartile range (IQR)
The third quartile minus the first quartile.
Q3 - Q1 = IQR
Mode
The output in a set of data that is recorded or observed the most.
Mean/average
The total of all the outputs in a set of data is divided by the number of outputs, giving one number to summarize the set of data.
x̄ = (∑xi) / (n)
Median
The middle number in a set of data when the numbers are put in order from least to greatest.
Outlier
A piece of data which varies significantly from the median of the data, caused a skewed mean and data set.
Lower outlier < Q1 -1.5(IQR)
Higher outlier <Q3 + 1.5(IQR)
Census sampling method
A study that collects from the entire population (not practical). Example: a conducted study used the entire population of Paris to measure the average height.
Simple random sample sampling method (SRS)
Every subset of individuals from a population have an equal chance to get selected. Example: all participants put their names in a lottery to see who will be chosen for the study.
Stratified sample sampling method
Population is split into homogeneous groups (strata), and a random sample is taken from each group. Example: A study randomly selects 10 people from every job in NJ to measure wages.
Cluster sample sampling method
The population is split into heterogeneous groups (clusters), and a random sample is taken from each. Example: A study used 3 middle schools in NJ to study grades.
Systematic sample sampling method
Begins with a random starting point and then selects every nth individual. Example: A study used every tenth person that comes into work starting from Jerry to measure height in the office.
Normal distribution
A bell-shaped symmetric curve that follows the empirical rule. The empirical rule states that for a distribution to be normal 68% of data lies within one standard deviation (μ ± 1σ) of the mean. 95% of data lies within two standard deviations (μ ± 2σ) of the mean. 99.7% of data lies within three standard deviations (μ ± 3σ) of the mean.

Z-score
Tells you how many standard deviations a specific data point lies above or below the mean of a distribution.
z = (x − μ) / σ