3.1.2 Price determination in a competitive market - AQA A-Level Year 1 Economics
 Call Kai
 Learn
 Practice Test
 Spaced Repetition
 Match
 Flashcards
 Knowt Play
1/159

There's no tags or description
Looks like no tags are added yet.
160 Terms
3.1.2.1 The determinants of the demand for goods and services
--Content
The factors which determine the demand for a good or service.
A demand curve shows the relationship between price and quantity demanded.
The causes of shifts in the demand curve.
--Additional information
Students should understand the factors that influence the spending decisions of consumers, including: price, income, wealth, the price of substitutes and complementary goods, and individual preferences. They should also appreciate that such decisions are influenced by social and emotional factors.
Competitive market
A market in which the large number of buyers and sellers possess good market information and can easily enter or leave the market.
What is a market?
A market is a voluntary meeting of buyers and sellers. Both buyer and seller have to be willing partners to the exchange.
Where are markets?
Markets do not have to exist in a particular geographically location. Over history, market transactions shifted away from open-air street markets to take place in shops. Shops have higher overhead costs, but they offer a permanent site of exchange and a continuing relationship between sellers and buyers.
The advance in technology and market transactions
In recent years, the growth of the internet has allowed 24/7 e-commerce. As a result many markets, especially those in commodities, raw materials and financial services, have become truly global.
Market transaction
Whenever a good or service is voluntarily bought and sold.
Forced transaction
Where a buyer or seller uses violence or the threat of violence to 'persuade' a seller to supply goods at a price unfavourable to the seller. This is not a market transaction.
Equilibrium price
The price at which planned demand for a good or service exactly equals planned supply
Supply
The quantity of a good or service that firms are willing and able to sell at given prices in a given period of time.
The 'law' of supply
Producers offer more of a good as its price increases and less as its price falls
Demand
The quantity of a good or service that consumers are willing and able to buy at given prices in a given period of time. For economists, demand is always effective demand.
Effective demand
The desire for a good or service backed by an ability to pay.
Market demand
The quantity of a good or service that all the consumers in a market are willing and able to buy at different market prices.
When is a market competitive
When there are a large number of buyers and sellers all passively accepting the ruling market price that is set, not by individual decisions, but by the interaction of all those taking part in the market.
Ruling price
Also known as the equilibrium price.
Individual demand
Contrasting with market demand, individual demand is the quantity that a particular individual, such as yourself, would like to buy.
The relationship between individual demand and market demand
Market demand is just the sum of the demand of all the consumers in the market.
The 'law' of demand
states that as a good's price falls, more is demanded. This is an inverse relationship between price and quantity demanded.
Why the 'law' of demand is a law
'law' is in inverted commas. This is because a law in economics is not as strong or watertight as a law in a natural science subject such as physics. A law in physics will always hold, a social science law always has 'ifs' and 'buts' attached.
Market demand curve
This curve illustrates the 'law' of demand.

Synoptic link 2
Microeconomic demand curves look very similar to aggregate demand curves. It is vital that there is no confusion between the two.
Shifts vs Movement in demand curves
Some students often confuse a movement along a demand curve and a shift of the demand curve.
Movement along a demand curve
A movement only takes place when the good's price changes. Provided the demand curve slopes downwards (Left, Top - Right, Bottom), a fall in price results in more of the good being demanded. This is sometimes called an extension of demand. A rise in price leads to a rise in price leads to less being demanded.

Shifts of a demand curve
When we draw a demand curve, we assume that all other things are constant. This is the ceteris paribus assumption, which means 'other things being equal'. When the conditions of demand change, the demand curve shifts to a new position.

Conditions of demand
A determinant of demand, other than the good's own price, that fixes the position of the demand curve
Study tip 6
You must understand the difference between a movement along a demand or supply curve and a shift of the curve.
Increase in demand
A rightward shift of the demand curve.
Decrease in demand
A leftward shift of the demand curve.
The conditions of demand
-The prices of substitute goods or goods in competing demand
-The prices of goods in joint demand or complementary goods
-Personal income (or more strictly personal disposable income, after tax and receipt of benefits)
-tastes and preferences
-population size, which influences total market size
The effect of a rightward shift of demand

Normal good
A good for which demand increases as income rises and demand decreases as income falls.
Inferior good
A good for which demand decreases when income rises and demand increases as income falls.
Events that might cause a rightward shift of a demand curve
-An increase in the price of a substitute good or good in competing demand
-A fall in the price of a complementary good or good in joint demand
-An increase in personal disposable income
-A successful advertising campaign making people think more favourably about the good
-An increase in population size
When disposable income increases
a demand curve shifts rightward, but only if the good is a normal good.
Some goods are inferior goods
for which demand decreases as income increases, and an increase in income shifts the demand curve leftward.
Normal good example
For young children, junk food such as sweets is usually a normal good. When parents increase small children's pocket money, they generally buy more sweets.
Inferior good example
As children get older, tastes change, and sweets may very well become an inferior good.
Exceptions to the 'law' of demand?
Speculative demand, good for which consumers use price as a n indicator of quality, Veblen goods.
Speculative demand
If the price of a good such as housing, shares or a foreign currency starts to rise, people may speculate that in the near future the price will rise even further. In this situation, demand is likely to increase. In the case of rising house prices, young people who wish to become first-time buyers may scramble to buy houses, fearing that if they wait, they may never be able to afford to buy a house.
Good for which consumers use price as a n indicator of quality
Consumers may lack accurate information about the quality of some goods they want to buy, such as second-hand cars and computers. In this situation, a potential buyer may demand more as a good's price rises, believing that a high price means high quality.
Veblen goods
Some companies try to sell their goods based on the fact that they cost more than those of their competitors. Veblen goods, named after the Norwegian economist Thornstein Veblen, are goods of exclusive or ostentatious consumption, or 'snob' goods. They are sometimes called positional goods, though strictly a positional good is so scarce that few people can ever acquire it. Some people wish to consume Veblen goods, such as Ferrari cars, as a signal of their wealth. The 'reassuringly expensive' advertising campaign for Stella Artois beer is a good example. A few years ago, Interbrew, the Belgian company (now called Inbev) that then owned the Stella brand, decided to sell its beer as a premium brand. Interbrew hoped that high prices would attract more customers. If you look at the prices of Stella beers you will finder that Inbev has now changed tack, selling its beer on a 'stack 'em high, sell 'em fast' principle, at discounted prices.
3.1.2.2 Price, income and cross elasticities of demand
--Content
Be able to calculate price, income and cross elasticities of demand.
The relationship between income elasticity of demand and normal and inferior goods.
The relationship between cross elasticity of demand and substitute and complementary goods.
The relationships between price elasticity of demand and firms' total revenue (total expenditure).
The factors that influence these elasticities of demand.
--Additional information
Students should be able to interpret numerical values of these elasticities of demand.
Elasticity
The proportionate responsiveness of a second variable to an initial change in the first variable.
The meaning of elasticity
Whenever there is a change in one variable (e.g. a good's price) causes a change to occur in a second variable variable (such as the quantity of the good that households are prepared to demand), an elasticity can be calculated. The elasticity measures the proportionate responsiveness of the second variable to the change in the first variable.
Three demand elasticities
Price elasticity of demand (PED), income elasticity of demand (YED), cross-elasticity of demand (XED)
Price elasticity of demand (PED) formula
Where %▵ indicates percentage change

Income elasticity of demand (YED) formula
Where %▵ indicates percentage change

Cross-elasticity of demand (XED) formula
Where %▵ indicates percentage change

Price elasticity of demand
Measures the extent to which the demand for a good changes in response to a change in the price of that good.
Study tip 7
You should apply elasticity analysis when assessing the effects of a shift of a demand or supply curve. The extent to which the good's price or equilibrium level of output changes depends on the price elasticity of the curve that has not shifted. For example, when the supply curve shifts leftward, the price elasticity of the demand curve determines the extent to which the good's price and quantity changes.
Test yourself - When the price of a small car is £15,000, there are 100,000 people in the UK who wish to buy it. When the price falls to £10,000, the number wanting to buy cars rises to 200,000. What does this information tell tip about the market for small cars in the UK?
Initial Price = 15000
New Price = 10000
Initial Quantity = 100000
New Quantity = 200000
PED = ( (200000 − 100000) / (200000 + 100000) / 2) / ( (10000 - 15000) / (10000 + 15000) / 2)PED = 0.1667 / -0.1
PED = -1.6667
Since PED > 1, demand is elastic
Study tip 8
Remember that elasticities are calculated by dividing the percentage change in quantity demand (or supplied) by the percentage change in the variable that caused the change.
If PED = 0
Demand is perfectly inelastic - Demand does not change at all when the price changes - the demand curve will be vertical.
If PED is between 0 and 1
(i.e. the % change in demand from A to B is smaller than the percentage change in price), then demand is inelastic.
If PED = 1
(i.e. the % change in demand is exactly the same as the % change in price), then demand is unit elastic. A 15% rise in price would lead to a 15% contraction in demand leaving total spending the same at each price level.
If PED > 1
Then demand responds more than proportionately to a change in price i.e. demand is elastic. For example if a 10% increase in the price of a good leads to a 30% drop in demand. The price elasticity of demand for this price change is -3
Perfectly elastic demand
Constant elasticity at all points on the curve.
PED = ♾

Elastic demand
PED > 1
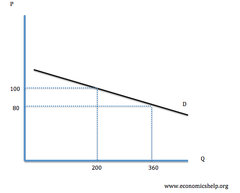
Unit elastic demand
PED = 1

Inelastic demand
PED < 1

Completely inelastic demand
Constant elasticity at all points on the curve.
PED = 0

Factors determining price elasticity of demand
Substitutability, percentage of income, necessities or luxuries, the 'width' of the market definition, time.
Substitutability
The most important determinant of PED. When a substitute exists for a product, consumer respond to a price rise by switching expenditure away from the the good and buying a substitute whose price has not risen.
Percentage of income
The demand curve for goods or services on which households spend a large proportion of their income tend to be more elastic than those of small items that account for only a small fraction of income. This is because for items on which only a very small fraction of income, particularly for those which are rarely purchased, people hardly notice the effect of a change in price on their income. The same is not true for 'big ticket' items such as a new car or a foreign holiday.
Necessities or luxuries
It is sometime said that the demand for necessities is price inelastic, whereas demand for luxuries is elastic. This statement should be treated with caution. When no obvious substitute exists, demand for a luxury good may be inelastic, while at the other extreme, demand for particular types of basic foodstuff is likely to be elastic if other staple foods are available as substitutes. It is the existence of substitutes that really determines price elasticity of demand, not the issue of whether the good is a luxury or a necessity.
The 'width' of the market definition
The wider the definition of the market under consideration, the lower the price elasticity of demand. Thus the demand for the bread produced by a particular bakery is likely to be more elastic than the demand for bread produced by all bakeries. This is because the bread baked in other bakeries provides a number of close substitutes for the bread produced in just one bakery. And if we widen the possible market still further, the elasticity of demand for bread produced by all the bakeries will be greater than that for food as a whole.
Time
The time period in question will also affect the price elasticity of demand. For many goods and services, demand is more elastic in the long run than in the short run because it takes time to respond to a price change. For example, if the price of petrol rises relative to the price of diesel, it will take time for motorists to respond because they will be 'locked in' to their existing investment in petrol-engine cars.
In other circumstances, the response might be greater in the short run than in the long run. A sudden rise in the price of petrol might cause motorists to economise in its use for a few weeks before getting used to the price and drifting back to their old motoring habits.
A simple rule for detecting whether demand is price elastic or inelastic
An alternative to the formula, a simple rule can be used to determine the general nature of the elasticity between the two points:
-If total consumer expenditure increases in response to a price fall, demand is elastic (PED > 1)
-If total consumer expenditure decreases in response to a price fall, demand is inelastic (PED < 1)
-If total consumer expenditure remains constant in response to a price fall, demand is neither elastic nor inelastic, i.e. elasticity = unity (or since the demand curve slopes downward, the elasticity is minus unity or -1)
Draw a diagram to illustrate war happens to total consumer expenditure in the event of a price fall when the demand curve is inelastic.
https://www.economicsdiscussion.net/wp-content/uploads/2018/06/clip_image027-1.jpg
-T ⮕ R represents the fall in consumer expenditure.
-Prices reduced from P to P1.
Income elasticity of demand (YED)
Measures the extent to which the demand for a good changes in response to a change in income (Y); it is calculated by dividing the percentage change in quantity demanded by the percentage change in income.
The income elasticity of demand for foreign holidays in the UK is +1.6. What does this tell you about UK demand for foreign holidays?
Demand responds more than proportionately to a change in price i.e. demand is elastic. For example if a 10% increase in the price of a good leads to a 30% drop in demand. The price elasticity of demand for this price change is -3.
Demand in the UK for foreign holidays is elastic. This is because elastic demand is where demand responds more than proportionately to a change in price.
Cross elasticity of demand (XED)
Measures the extent to which the demand for a good changes in response to a change in the price of another good.
How XED is calculated
By dividing the percentage change in quantity demanded of one good by the percentage change in the price of the other good.
The three possibilities for how goods respond
-Complementary goods (or joint demand)
-Substitutes (or competing demand)
-An absence of discernible demand relationship
Example of complementary goods
Cars and petrol (or diesel fuel). These goods are in joint demand. A significant increase in fuel prices will have some effect on the demand for cars, though the effect may not be great.
Example of substitute goods
Private car travel and bus travel are substitute goods. A significant increase in the cost of running a car will cause motorists to switch to public transport - providing its price does not rise by a similar amount as well.
Study tip 9
Elasticity basically means responsiveness. Demand elasticities measure how consumers respond to a change in a good's price, income, or the price of another good. You should learn the formulae for each type of elasticity, for example income elasticity demand and avoid making mistakes when using them.
These are:
-missing out the word 'percentage' (or the % sign) from the formula
-writing the formula 'upside down'
-confusing the different elasticities
3.1.2.3 The determinants of the supply of goods and services
--Content
The factors which determine the supply of a good or service.
A supply curve shows the relationship between price and quantity supplied.
Understand higher prices imply higher profits and that this will provide the incentive to expand production.
The causes of shifts in the supply curve.
--Additional information
Shifts in the supply curve
Caused by:
-input prices
-technology
-expectations
-number of sellers
Market supply
The quantity of a good or service that all firms plan to sell at given prices in a given period of time, assuming the conditions of supply remain unchanged. If the ceteris paribus assumption no longer holds, one or more of the conditions of supply change, the supply curve shifts to a new position.
Supply or market supply?
When economists refer to supply, they normally mean market supply. Market supply is the quantity of a good or service that all the firms or producers in the market plan to sell. As with demand, the relationship between the two is simple. Market supply is just the sum of the supply of all the firms or producers in the market at different market prices.
Profit
The difference between total sales revenue and total costs of production.
Total revenue (TR)
The money / income / revenue a firm receives from selling its output, calculated by multiplying the price by the quantity sold.
The market supply curve
A graph of the quantity supplied of a good by all suppliers at different prices.
Market supply curve example
The market supply curve displayed illustrates the 'law' of supply, which states that as good's price rises, more is supplied.

Synoptic link 3
Microeconomic supply curves look very similar to aggregate supply curves. Don't confuse the two.
Conditions of supply
Determinants of supply, other than the good's own price, that fix the position of the supply curve.
What are the conditions of supply
-costs of production including:
-wage costs
-raw material costs
-energy costs
-costs of borrowing
Shifts in the market supply curve
The supply curve shows the quantities of the good that all the firms in the market plan to supply at different possible prices.
Increase in supply
A rightward shift of the supply curve
Decrease in supply
A leftward shift of the supply curve
Increase or decrease in supply (graph)

Ad valorem or percentage tax
How the supply curve shifts depends on whether the tax firms are forced to pay is an ad valorem tax or a specific tax. In the case of an ad valorem tax such as VAT, which is levied at the same percentage rate (e.g. 20% - the standard) on the price, the new supply curve is steeper than the old supply curve. This is shown in the shift from Q, P to Q1, P1. If a good is priced at £1.00, 20% of the price without the tax is £0.20. However, if the price of a good is £2.00, the government collects £0.40 of tax revenue for each unit of the good sold.
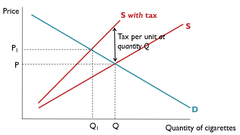
Specific or unit tax
Excise duty levied on tobacco, alcohol or petrol is an example. The tax levied does not depend on the good's price. Because of this, the new and old supply curves are parallel to each other. The shift from Q, P to Q1, P1 illustrates the size of the tax levied on each unit of the good. When an indirect tax is imposed on a good, the supply curve shifts vertically upwards by the amount of the tax.

Subsidy shifting a supply curve
A subsidy given by the government to producers has the opposite effect to an expenditure tax; it shifts the supply curve to the right. In the case of a specific subsidy, which is illustrated in the shift from Q, P to Q1, P1 which is the sum of money paid to firms for each unit of the good produced is the same whatever the price of the good and hence the vertical distance between the two supply curves equals the subsidy per unit. By. contrast, the size of the subsidy would vary if the subsidy were dependent on the price of the good.

3.1.2.4 Price elasticity of supply
--Content
Be able to calculate price elasticity of supply.
The factors that influence price elasticity of supply.
--Additional information
Students should be able to interpret numerical values of price elasticity of supply.
Price elasticity of supply
Measures the extent to which the supply of a good changes in response to a change in the price if that good.
Price elasticity of supply compared to demand elasticity
In contrast to demand elasticities, there is only one supply elasticity you need to know. This is a price elasticity of supply (PES), which measures how the supply of a good responds to an initial change in a good's price.
Perfectly elastic supply curve
A horizontal line reflecting a situation in which any price decrease drops the quantity supplied to zero; the elasticity value is infinity.
PES = ♾

Elastic supply curve
PES > 1, relatively flat, sellers' price sensitivity relatively high.
