conservation 2
 Call Kai
 Learn
 Practice Test
 Spaced Repetition
 Match
 Flashcards
 Knowt Play
1/70

There's no tags or description
Looks like no tags are added yet.
71 Terms
What is conservation genetics?
A combination of ecology, molecular biology, population genetics, mathematical modeling and evolutionary taxonomy

A small isolated population contains a harmful recessive allele.
Which change would make it more likely that the harmful allele affects phenotypes within a population? Why?
More homozygosity
Heterozygosity
The condition of having two different versions (alleles) of a particular gene or genomic marker at a specific location (locus) on a pair of homologous chromosomes, typically inherited from each biological parent.
increased with larger population size, gain of genetic variation, everybody have a mate

Homozygosity
a genetic condition in which an individual inherits two identical alleles (gene variants) at a specific chromosomal locus from both biological parents
increased by small populaiton size, loss of genetic variation

Inbreeding depression is reduced fitness in offspring.
Caused by:
• Increased probability that offspring will be homozygous for a deleterious recessive gene
• Decreased adaptive potential
• Decreased adaptive potential
• Reduced genetic (and thus phenotypic) variation for selection to act upon.
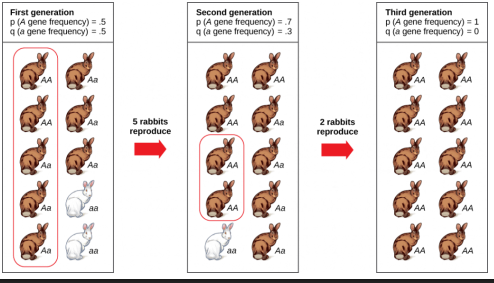
genetic drift
when something causes population or offspring to die off
the losing of a trait/allele
gene flow
when individuals breed together and genes flow between the two in offspring
natural selection
when the environment favors a trait/individuals or others
what happens to drift when population sizes get smaller
it gets stronger
Why is genetic drift stronger in small populations?
n small populations, only a few individuals carry a single allele, increasing the likelihood that the allele will be lost over each generation
Reading heterozygosity
Population A has H = 0.80
Population B has H = 0.25
Which population has greater genetic variation?
A, more heterozygosity means more chances offspring will vary gentically
What would produce higher than expected heterozygosity?
recent mixing of two formerly isolated populations
Two populations each contain 100 individuals….
Population A: 50 males + 50 females; individuals contribute fairly equally to reproduction
Population B: 5 males + 95 females; only 5 males reproduce.
Which population probably has higher heterozygosity?
population A
The number of individuals ≠ the number contributing genes
census population size (N)
Effective population size (Ne)
census population size (N)
How many individuals are there?
effective population size (Ne)
how many individuals are contributing genes to the next generation
What type of population is likely to have the smallest effective population size?
50 males + 50 females, polygynous reproduction
lowers population effectiveness
bettter for individual, not population
What else can lower Ne (other than number of individuals and social system)?
age structure
stressors
life history
sexual selection
sex ration skews
social systems
limited habitat
Ne affects heterozygosity changes due to drify
The change in heterozygosity between generations due to drift can be determined using this formula:
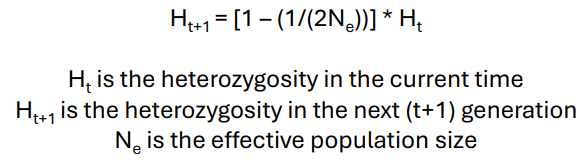
Ht
the heterozygosity in the current time
=H
Ht+1
the heterozygosity in the next (t+1) generation
Ne
the effective population size
mutation increase genetic variation
Mutation rate is relatively low
Slow source of new variation, only effective for very large populations
gene flow: increase genetic diversity
Very fast source of new variation
Best for small populations; introduces new genes and decreases relatedness
Is there one number that would tell us whether a population is safe?
No – the appropriate population size depends on the species and threats it faces.
A small isolated population is losing genetic variation through drift. Which process could counteract that loss most directly?
gene flow
Population vulnerability depends on:
• Demographic stochasticity
• Environmental stochasticity
• Genetic stochasticity
• Natural catastrophes
A minimum viable population . . . is the smallest isolated population having a 99% chance of remaining extant for 1000 years
get this number from
• Real population studies
• Statistical modeling (MVP / PVA)
Data from real populations for minimum population sizes
Studies of real populations suggest at least a few hundred individuals, but it depends on the species
• For solid estimates we need long-term datasets
• Long-term datasets are time- and cost-intensive
Statistical analysis: Minimum viable population size
Estimates based on Minimum Viable Population analyses led to the “50/500 rule”
“50/500 rule”
• Ne of 50 needed for short-term avoidance of inbreeding
• Ne of 500 needed for long-term avoidance of negative effects of drift
• Widely misinterpreted
• Ne was assumed to equal census population
• Focused on 50 not 500
Statistical analysis: Population Viability Analysis
• Estimates based on Population Viability Analysis
One vertebrate study found that the mean minimum viable population size was about 7300 adults, while the median was about 5800 adults.
• Long-term datasets led to larger estimates
• This suggests that estimates based on short-term studies are probably underestimates of the true minimum viable population
Minimum population sizes - summary
Each of these techniques yielded different estimates (a couple hundred, 500, ~7000)
Overall, studies suggest we need at least several 100, and perhaps several 1000 individuals. But there’s a lot of variation between species/populations
With no other information, this rule of thumb might be an OK starting point
But it would be much better to collect the data needed to investigate the species’ individual case
Small populations create a genetic feedback loop
1. Small population
2. stronger genetic drift
3. greater likelihood of inbreeding
4. Loss of genetic variation/increased homozygosity
5. Reduced adaptive potential and potentially lower fitness
6. Greater vulnerability to environmental change
7. Potentially even smaller population
A population has dropped below its estimated minimum viable population (MVP) due to habitat loss. What is a plausible intervention?
Habitat restoration
Captive breading and reintroduction
Translocation from another population
What is restoration?
Society for Ecological Restoration: ... the process of intentionally altering a site to establish a defined, indigenous, historic ecosystem. The goal of this process is to emulate the structure, function, diversity and dynamics of the specific ecosystem.
It is intentional, has a defined ecological goal, and considers ecosystem function and dynamics.
Why do we restore?
Improve ecological resilience & integrity
Improve sustainability and reduce the need for active management
Recover historic structure, function, and diversity
Restoration is a continuum of intensity
Don’t do anything
Reclamation
Rehabilitation
Partial restoration
Complete restoration
Don’t do anything
(e.g., allowing a grassland to become a forest, or a secondary forest to become an old-growth forest)
Reclaiming
addresses severe degradation and improves productivity, biodiversity, or ecosystem if the resulting ecosystem is very different from the historic ecosystem
• -E.g., non-native vegetation may be planted when non-native plant communities are better than no plant community
Rehabilitation
moves toward the historic ecosystem but is constrained by feasibility, logistics, or environmental conditions.
Partial restoration
restores some, but not all components of the historic ecosystem
Compete restoration
Total restoration of the historic ecosystem
Very difficult

Scale is a major limitation to restoration
Most restoration efforts are small and site-specific while many restoration needs are broad and long-term
First steps to restoration
Assess whether action is needed
Inventory and describe the site
Determine what level of restoration is needed.
Identify and prioritize goals and objectives.
Determine what level of restoration is needed.
Can we not do anything and achieve our goals?
Could we just do a simple clean-up?
Or do we need more intensive intervention?
Identify and prioritize goals and objectives.
Should be measurable
You've restored - now how do we know if it worked?
We can conduct an experiment
Main elements of experiments for restoration:
Control areas:
Reference sites:
Treatments:
Confounding variables:
Control areas
locations that do not receive restoration. Comparing treated (i.e., restored) areas to control areas helps you determine if changes are attributable to restoration or other events.
Reference sites
locations representing the ecosystem or ecological conditions you're trying to achieve.
Treatments
The restoration actions being tested
Confounding variables:
extraneous, unmanaged variables that correlate with both your independent and dependent variables, creating a false relationship or masking a true one.
E.g., a variable may correlate with both the restoration and the desired ecosystem outcome, making it hard to tell if restoration caused the outcome.
Example of a confounding factor in restoration
Managers plant native vegetation at one degraded coastal site and find that vegetation cover increase the following year. Did the restoration work?
Not necessarily.
• Confounding variables: Rainfall my have increased at the site, and vegetation would have increased regardless of restoration.
What is this "experiment" missing?
A control site would help to distinguish between these explanations.
A reference site would provide a comparison for the desired ecological outcome.
Replication would also be helpful!
What do we do after we've checked if restoration worked?
Adaptive management: Learn, evaluate, and adjust.
The adaptive management cycle
Plan: Set objectives and choose an intervention.
Do: Implement the intervention.
Monitor
Learn: Compare results with expectations.
Back to planning: Adjust the management approach based on what was learned.
How do we know if restoration is working?
Clearly define the desired ecological outcome in a way that can be measured
Choose a restoration approach appropriate to the site's conditions and project's goals.
Measure the outcome using a thoughtful study design (controls, reference sites, acknowledging confounding variables).
Monitor the results and adapt management.
Evaluate whether local success contributes to the larger conservation goal.
A severely degraded site is treated to improve soil stability and ecosystem function, but managers do not attempt to recreate its historic ecosystem. Which approach best describes this?
Reclamation
Managers want to determine whether a restoration treatment caused an increase in native plant cover. Which design feature would be most useful for comparison?
A control area that does not recieve the treatment
What is the primary role of a reference site in a restoration study?
To represent the ecological conditions the project aims to achieve
Managers monitor a restoration project and find that planted native vegetation repeatedly fails to establish. Which response best reflects adaptive management?
Investigate the outcome and adjust the intervention based on evidence
A habitat patch meets all its restoration objectives, but it remains isolated from other suitable habitat. Which conclusion is best supported from the lecture?
Local restoration success may not resolve broader landscape-level conservation problems
Following restoration vegetation cover increases. Given only this information, we can conclude that the restoration caused the vegetation increase.
false
What was the primary way DDT harmed bird populations like bald eagles and ospreys?
It thinned eggshells, making them too fragile for incubation.
How did Rachel Carson’s book Silent Spring impact environmental policy?
It raised public awareness about environmental hazards and led to restrictions on DDT.
hat was one major challenge faced when reintroducing captive-bred whooping cranes into the wild?
The cranes could not learn natural behaviors like migration and parental behaviors, because they had no adult models.
What was an important strength of the Endangered Species Act (ESA) of 1973?
It provided a legal framework to protect endangered species and their habitats.
Which of the following was NOT a direct result of conservation efforts in the mid-20th century?
he recovery of the whooping crane population to historic levels and distribution.