3.3.2 Costs
 Call Kai
 Learn
 Practice Test
 Spaced Repetition
 Match
 Flashcards
 Knowt Play
1/14

There's no tags or description
Looks like no tags are added yet.
15 Terms
What is TC, and its formula?
TC is all the costs for producing Q.
TC= TFC + TVC
What is TFC, and examples of FC?
TFC are costs that do not change with output and remain constant
examples of fixed costs= rent, salaries, interest on loans, advertising, business rates
What is TVC, and examples of VC?
TVC are costs that change directly with output
examples of variable costs= wages, utility bills, raw materials costs, transport costs
What is AC// ATC, and its formula ?
AC// ATC= costs per unit
A(T)C= TC/Q
What is the formula for AVC?
AVC= TVC/Q
What is MC, and what is its formula?
MC is the extra cost of producing one extra unit of a good.
MC= △TC/△Q
What is the shape of MC curve?
Shape of the MC curve=
The marginal cost curve is U-shaped, due to the law of diminishing marginal productivity.
At first, as output increases, MC falls. This means that producing an additional unit (the marginal unit) costs less than the cost of producing the previous unit.
After we have reached the lowest point on the MC curve any additional unit will cost more than the previous unit
What is the shape of the ATC curve?
Shape of the ATC curve=
The ATC curve is U-shaped, due to the law of diminshing marginal productivity.
Costs initially fall as machinery is used more efficiently but as production continues to expand, efficiency falls as machinery is overused.
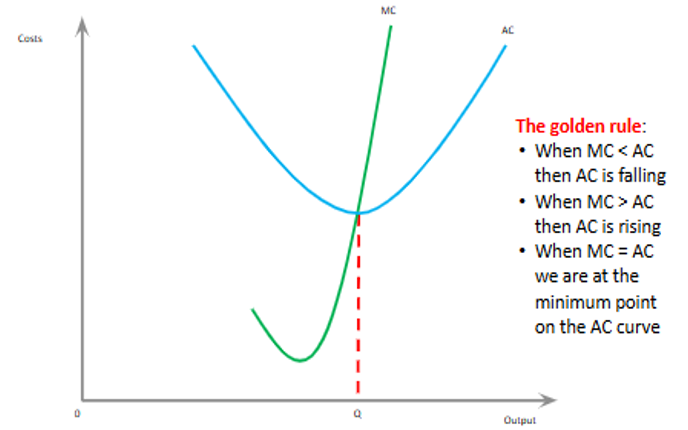
What is the relationship between the MC and AC?
The MC curve always cuts the AC curve at its lowest point.
When MC < AC, then AC is falling, since producing one more costs less than the average, so the average falls
When MC > AC, then AC is rising,
What is the shape of AFC?
The AFC starts high as the whole FC are being divided by a small output. As output is increased, AFC falls as the same amount is divided by a larger number.
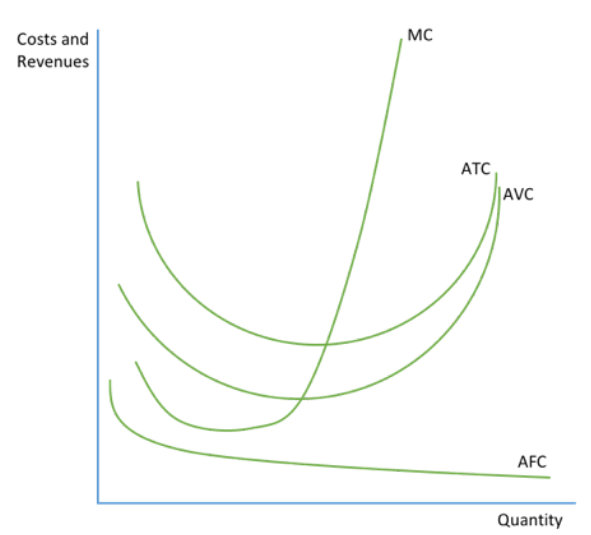
What is the shape of AVC?
AVC is U-shaped, but its gets closer to ATC as output increases since AFC gets smaller.

What is the shape of TC curve?
TC curve is upwards sloping. Total cost (TC) is always rising. This is because the marginal cost of producing an additional unit is always above £0. Therefore, it adds to TC. At first total cost (TC) is rising at a diminishing rate. This occurs because MC is falling (the orange section of the TC curve).
After the MC curve is at its lowest point TC starts to rise at an increasing rate. This occurs because MC is rising (the purple section of the TC curve).

What are the reasons to why the SRAC and LRAC are U-shaped?
SRAC is U-shaped because of law of diminishing returns.
LRAC is U-shaped because of EoS and DoS.
What is the diagram showing SRAC and LRAC?
The firm may initially be set up to produce a certain amount a day and have enough machinery to do so effectively. They may become popular and need to produce more than that this amount and in the short run this will cause a rise in SRAC due to the law of diminishing returns as some factors of production are fixed. In the long run, all factors become variable and so the SRAC curve can be shifted. The new SRAC curve will be lower since the firm is able to enjoy economies of scale. This will continue to occur until the firm begins to experience constant returns to scale and eventually diseconomies of scale.

What does movement along the LRAC and shift on LRAC indicate?
Movement along the LRAC is due to a change in output which changes the AC of production due to internal E/DoS.
Shift of LRAC can occur due to external E/Dos, taxes or technology, which affect c.o.p for a given level of output.