Topic 6- Aggregate Expenditure Model
 Call Kai
 Learn
 Practice Test
 Spaced Repetition
 Match
 Flashcards
 Knowt Play
1/34

There's no tags or description
Looks like no tags are added yet.
35 Terms
Aggregate Expenditure Model
the economy’s total level of output and income (real GDP) is determined by aggregate expenditures (or aggregate demand)
focuses on short-run determination of total output (assuming price level is constant)
developed by John Maynard Keynes
AE Formula
AE = the total planned spending in the economy
AE = C + IP + G + NX
4 Components of AE
Consumption (C)- spending by households on goods/services
Planned Investment (IP)- planned spending by firms on capital goods and by households on new homes
Government Purchases (G)- spending on all levels of government on goods/services
Net Exports (NX)- the value of exports minus imports
Planned vs. Actual Investment
Planned Investment (IP)- what firms intend to invest and the inventory they expect to hold
Actual Investment (IA)- what firms actually invest, including unplanned inventory changes
the difference between actual and planned investment shows up as unplanned changes in inventories
Formula for Unplanned Changes in Inventories
Actual Investment - Planned Investment
Equilibrium
occurs when actual investment = planned investment
unplanned changes in inventories = 0
spending on output = actual output produced
Equilibrium Condition
Aggregate Expenditure (AE) = Real GDP (Y)
Planned and Actual Spending Equations
IP = New Capital Stock + Planned Inventory
IA = New Capital Stock + Actual Inventory
When AE > Real GDP
firms sell more than expected (shelves empty fast)
inventories fall (actual sales > expected sales)
firms increase production next period
GDP and Employment increase
When AE < Real GDP
firms sell less than expected (unsold goods pile up)
inventories rise (actual sales < expected sales)
firms cut production next period
GDP and Employment decrease
Moving Toward Equlibrium
if the macroeconomy is NOT in equilibrium, firms adjust level of production to move the economy toward equilibrium
unplanned inventory changes tell firms if they produced the “right” amount or not
Aggregate Consumption Function
shows level of aggregate consumption at each level of aggregate national income (real GDP)
C = a + MPC(Y - T)
a = autonomous consumption
MPC = marginal propensity to consume
Y - T = disposable income
Autonomous Consumption
the level of spending by households when income is equal to 0
Y - T = 0
Disposable Income
Disposable Income = Real GDP (Y) - Net Taxes (T)
any disposable income NOT consumed by the household is saved
Real GDP (Y) = Consumption + Savings + Taxes
Marginal Propensity to Consume (MPC)
MPC = (change in consumption / change in income)
AKA: change in C / change in Y
slope of the AE Consumption function
rate at which excess income becomes excess spending
Marginal Propensity to Save (MPS)
MPS = (change in savings / change in income)
AKA: change in S / change in Y
MPC + MPS = 1
Factors that Effect Level of Consumption (6)
Current Disposable Income- more income = more money to spend
Household Wealth- rising asset values = more financial security/spending
Expected Future Income- expected higher income = more willing to spend than save
Price Level (average prices)- higher prices reduce purchasing power so consumers spend less (inverse relationship)
Interest Rates- higher rates make borrowing more expensive and encourage saving over spending (inverse relationship)
Taxes- higher taxes lead to less disposable income/spending (inverse relationship)
Investment (I)
most volatile component of Real GDP
adds to the nation’s capital stock
Investment = Residential + Business Fixed (planned) + Changes in Inventory
Factors that Affect Investment (4)
Expectations for Future Profitability- firms are more likely to invest if they expect high returns
Interest Rate (nominal)- higher rates increase the cost of borrowing, making investment projects more expensive (inverse relationship)
Corporate Taxes- higher taxes = lower profits = less incentive to invest (inverse relationship)
Cash Flow (cash or liquid assets)- more internal funds makes it easier to finance investment without needing to borrow
Government (G)
real government purchases include purchases at all levels of government: federal, state, and local
spending is determined by policy and not driven by income
Taxes
taxes collected by the government = T
lump sum tax- does NOT change with income (fixed)
proportional tax- varies with the level of income (Y)
Budget Deficit vs. Surplus
deficit: G > T (government spending is greater than tax revenue)
surplus: G < T (tax revenue is greater than government expenditures)
Factors that Affect Net Exports (3)
Price Level (in the US vs other countries)- if US goods are more expensive, exports go down and imports go up
Growth Rate (in the US vs other countries)- higher growth in the US increases income/demand for imports, while foreign demand for exports may not rise as much
US Dollar Exchange Rate- a stronger US dollar makes exports more expensive to foreign buyers and imports cheaper for US consumers
Autonomous AE
spending that does not vary with the level of real GDP
in the simple model, Investment, Government, and Net Exports are all autonomous
AE Equation
AE = [C (autonomous) + IP + G + NX] + MPC(Y)
Induced Expenditure
spending that varies with the level of Real GDP
AE Model on a Graph
45 Degree Line- shows all points where planned aggregate expenditure equals real GDP (Y = AE)
Autonomous AE- level of spending when real GDP = 0
Equilibrium- occurs where the AE line intersects the 45-degree line
Slope of the AE function
Slope AE = (change in aggregate expenditure/change in income)
AKA: (change in AE / change in Y)
tells us the fraction of any change in real GDP that will be spent
in the simple model, the AE slope is MPC
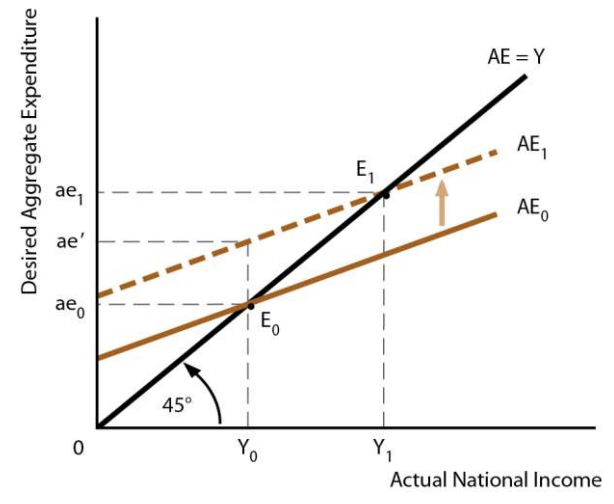
Parallel Shift in the AE Function
the AE function can shift parallel to itself with a change in autonomous spending
whole line shifts upwards, while the 45-degree line remains constant
this shifts the equilibrium point to a higher level of AE and Y
Change in the Slope of AE
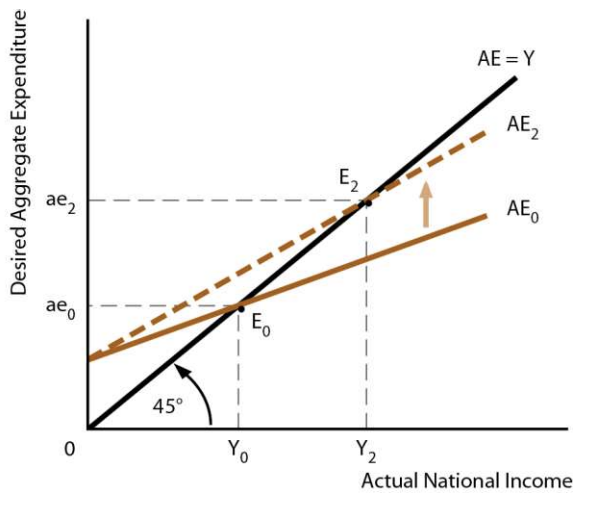
results from a change in the marginal propensity to spend
the AE line becomes steeper or shallower
if the slope increases, equilibrium (where AE and the 45-degree line intersect) moves upwards and occurs at a higher level of AE and Y
AE Multiplier Effect
a change in spending leads to a larger change in equilibrium GDP
the change in equilibrium real GDP = the change in autonomous spending multiplied by the AE spending multiplier
in reality, the size of the multiplier is around 2
AE Multiplier Formula
AE Multiplier = 1 / (1 - MPC)
Change in Real GDP Formula
Change in Real GDP = (change in AE) x (AE Multiplier)
More About the AE Multiplier
the spending multiplier effect occurs both for an increase and a decrease in planned AE
because the spending multiplier is greater than 1, the economy is sensitive to changes in autonomous expenditure
the larger the MPC, the larger the value of the multiplier
the simplified model omitts some complications (as real GDP changes, imports, inflation, interest rates, and income taxes change)
Aggregate Demand and Aggregate Supply
the AD-AS model is used to analyze the overall production and price level of an economy
helps economists understand how different economic events can affect the 3 macroeconomic goals (growth, unemployment, inflation)