3.4 - Carrying Capacity
 Call Kai
 Learn
 Practice Test
 Spaced Repetition
 Match
 Flashcards
 Knowt Play
1/10

There's no tags or description
Looks like no tags are added yet.
Name | Mastery | Learn | Test | Matching | Spaced | Call with Kai | Chat |
|---|
No analytics yet
Send a link to your students to track their progress
11 Terms
Carrying Capacity
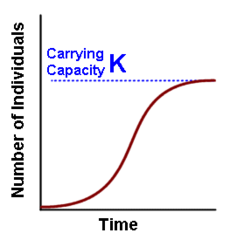
the maximum number of individuals in a pop. that an ecosystem can support (based on limiting resources)
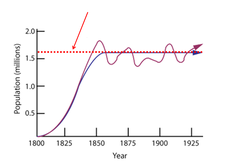
K
Letter for carrying capacity
Theoretical carrying capacity graph
Realistic carrying capacity graph
- Population briefly "overshoots", then die-off happens

Food, water, and habitat (nesting sites, space)
What determines carrying capacity?
Overshoot
when a population briefly exceeds carrying capacity
- ex. Deep breed in fall, give birth all at once in spring. Sudden spike in population = overshoot
resource depletion (ex: overgrazing in deer)
Consequent of Overshoot
Die-Off
sharp decrease in pop. size when resource depletion (overshoot) leads to many individuals dying
- Ex: many deer starve with too many new fawns feeding in spring
Case Study of Reindeer in Alaska
Reindeer of St. Paul Island:
- 25 introduced in 1910
- Growth was gradual (10'-30'), then exponential (30'-37')
- Carrying capacity was overshot
- Sharp die-off lead to pop. crash as food resource (lichen) were severely depleted
resource depletion; collapse
Real populations don't always fluctuate around carrying capacity. If _____________ is severe enough, total population ________ can occur
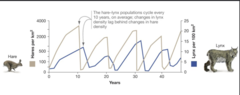
Carrying Capacity + Predator/Prey Graph
1.Hare population increase due to low predator population (lynx)
2.Lynx population increase due to increase in food (hare)
3.Increasing lynx pop. limits hare pop; leads to die-off
4.Hare die-off decreases lynx food source, leading to die-off
5.Hare pop. increase due to low predator pop. (lynx)