ECON 2310 Nonstationary Time Series
 Call Kai
 Learn
 Practice Test
 Spaced Repetition
 Match
 Flashcards
 Knowt Play
1/71

There's no tags or description
Looks like no tags are added yet.
72 Terms
so far we have assumed the data are stationary

2 important types of nonstationarity

what is a trend
A trend is a persistent, long-term movement or tendency in the data. Trends need not be just a straight line
does this have a trend?


is this a trend?

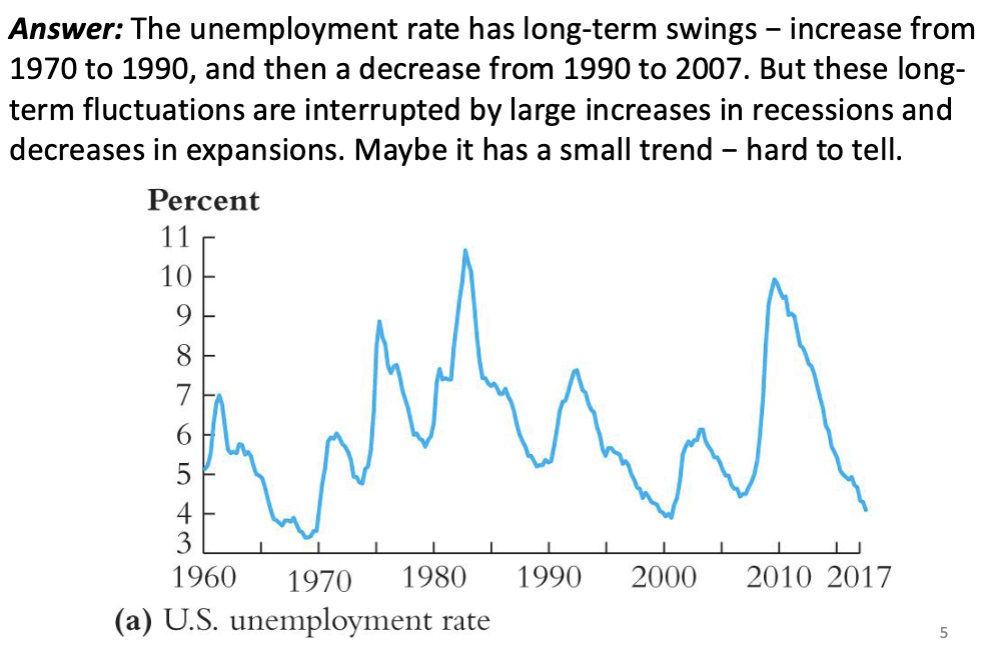
is this a trend?

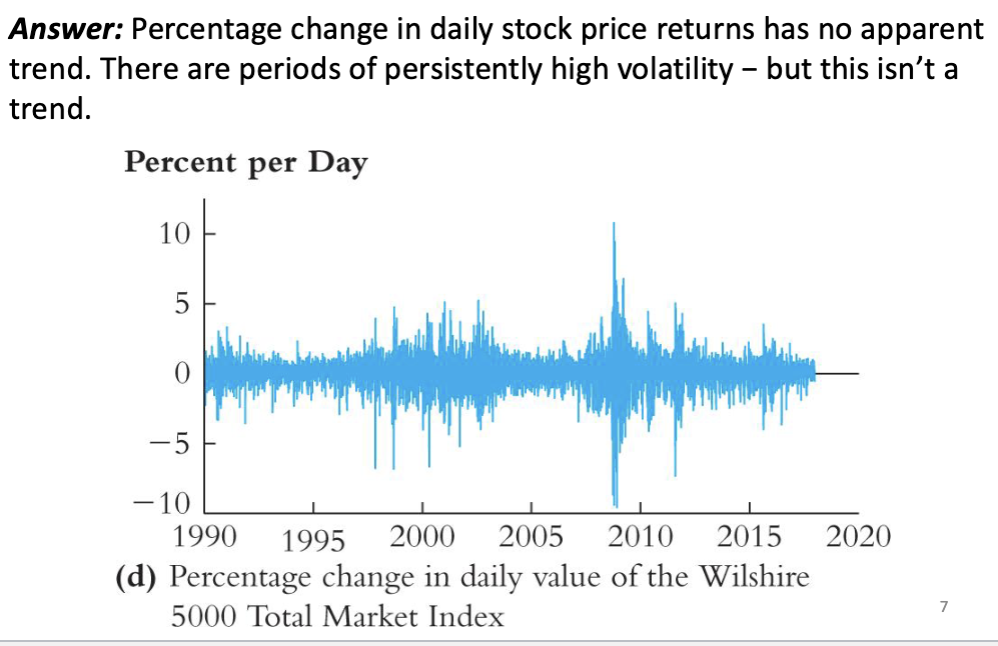
deterministic trend

stochastic trend

random walk

2 features of random walk


stochastic trend feature 1

stochastic trend feature 2

random walks diagram


random walk with drift model

the drift is…

The random walk model (with or without drift) is
The random walk model (with or without drift) is a good description of stochastic trends in many economic time series.
there is practical advice:

Upcoming specifics that lead to this advice

random walk with drift vs AR(1)

random walk with drift vs AR(1) notes

unit root terminology

unit roots in AR(2)

unit roots in AR(2) rearrange regression

unit roots in AR(2) subract Yt-1 from both sides

unit roots in AR(2) simplify

AR(2) can be rewritten as



unit root in AR(2) claim shows that

problem 1 caused by trends
AR coefficients are strongly biased towards zero leading to poor forecasts. Some t-statistics don’t have a standard normal distribution, even in large samples
notes on problem 1
If a regressor has a stochastic trend, then its usual OLS t-statistic can have a nonnormal distribution under the null hypothesis, and the estimate of the autoregressive coefficient is biased toward 0
– This nonnormal distribution means that conventional confidence intervals are not valid and hypothesis tests cannot be conducted as usual
problem 2 caused by trends
If two time series both have random walk trends, they can look related even if they are not – “spurious regressions”


How do you detect stochastic trends?
plot data
Dickey Fuller test
plot data
are there persistent long-run movements?
dickey fuller test

Detecting Stochastic Trends: Testing for a Unit AR Root

Detecting Stochastic Trends: Testing for a Unit AR Root notes

We need to use the table of Dickey-Fuller critical values.
There are two cases, which have different critical values:

dickey fuller table

dickey fuller table notes

When should you include a time trend in the DF test?
The decision to use the intercept-only DF test or the intercept & trend DF test depends on what the alternative is – and what the data look like.

a-intercept and b-intercept/time trend specifications




The second type of nonstationarity we consider is that

It is a problem for forecasting if the model describing the historical data

nonstationarity breaks outline

breaks can arise from



case 1 ADL(1,1) case

case 1 ADL(1,1) case notes


chow test stat notes
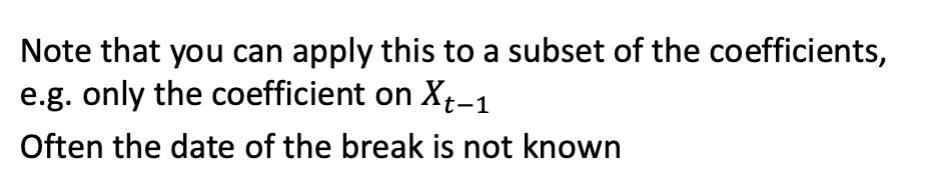



QLR stat notes

Quandt Likelihood Ratio (QLR) Statistic

Quandt Likelihood Ratio (QLR) Statistic notes

Quandt Likelihood Ratio (QLR) Statistic graph
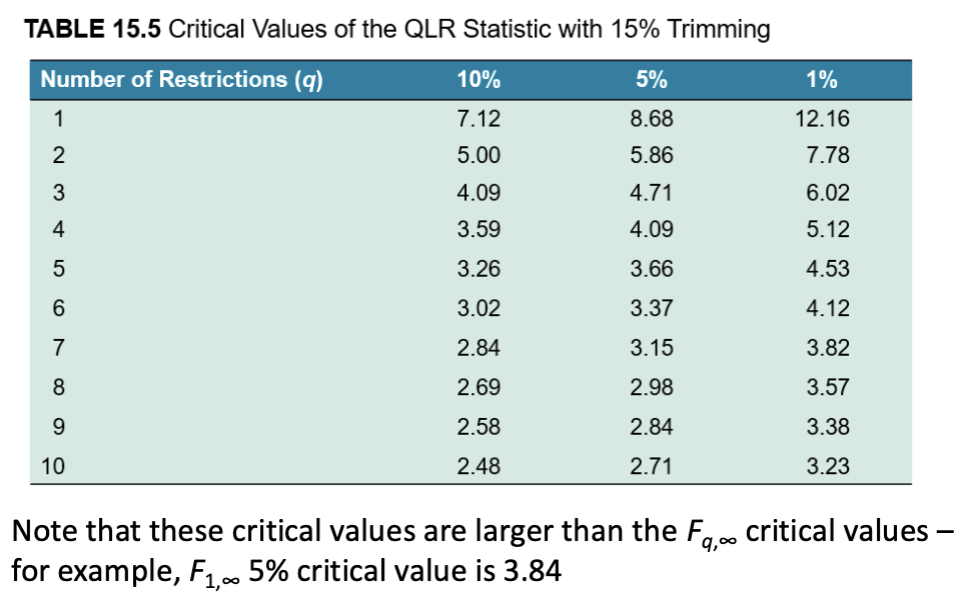
Quandt Likelihood Ratio (QLR) Statistic second graph

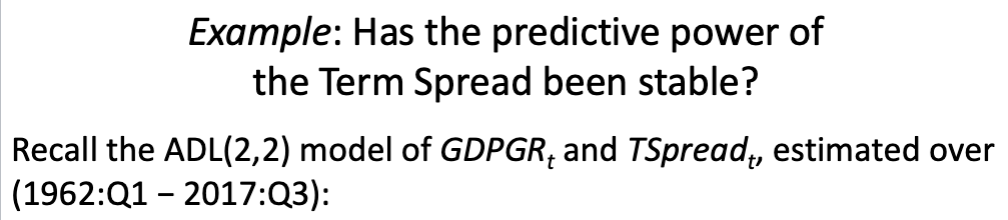


dependent variables and regressors


notes
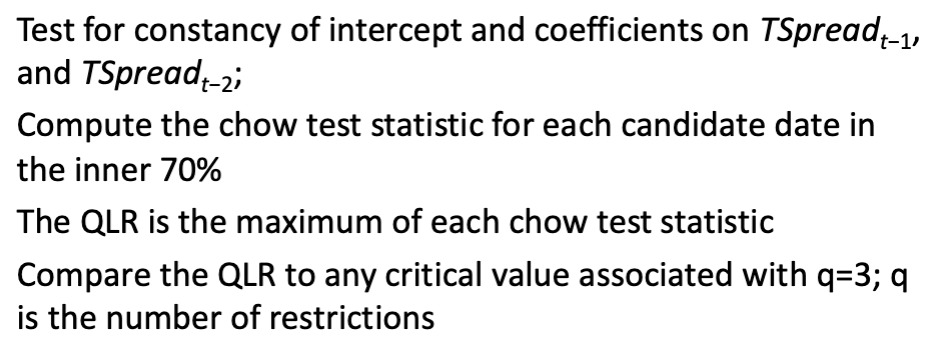

graph


QLR =


Detecting Breaks Using Pseudo Out-of-Sample Forecasts cont