Biodiversity Exam #4
 Call Kai
 Learn
 Practice Test
 Spaced Repetition
 Match
 Flashcards
 Knowt Play
1/54

There's no tags or description
Looks like no tags are added yet.
55 Terms
define population
a group of individuals of the same species that live in a specific geographic area at the same time and that have the potential to interbreed and produce fertile offspring
define biological community
an interacting group of various species’ populations that occupy a shared geographical area at the same time
explain if size of populations being the same means the populations are equivalent, why or why not, and an example
two populations being the same size does not make them equivalent, other factors
density of the populations (ex. new york and florida)
is a population census plausable for a natural population
no, it is impossible to get an exact population size number like you can with humans, so you have to estimate the population sizes
list the types of population estimates that can be done on natural populations
1) quadrats
2) transects
3) mark and recapture
what types of natural population estimates sample within defined boundaries
quadrat and transect sampling
describe the steps of mark and recapture population sampling
1) animals in first catch are tagged
2) they are released back into the wild
3) come back and do the same sampling method as first time
4) note the tagged and recaptured animals caught the second time
draw quadrat and transect population sampling

write the equation for mark and recapture
# marked first catch x # total second catch / # marked second catch = N (estimated population size)
calculate the estimated population size: 80 field mice captured, marked and released first catch. 100 mice captured second catch, and 20 are marked
80 × 100 / 20 = 400
list and draw and give example for the types of species distributions
1) random —> dandilions
2) clumped —> elephant herd
3) uniform —> penguins during laying season

explain the key factor when describing a population and carrying out a survey
natural populations can display different types of distribution in the wild depending on the time of year, season, ecosystem, etc.
in order to carry out an accurate survey for an organism, you have to know what type of distribution pattern they are displaying
leverage knowledge about the organism to make the sample as accurate as possible
define demography and what it is defined with
the study of how populations change over time
birth rates
death rates
life expectancy
write the equation for the mortality rate
# of individuals dying
_______________________ x 100 = mortality rate
# of individuals surviving
write the equation for the survival rate
1 - mortality rate = survival rate
what tends do demography, birth and death rates expose
able to look at changes to death rates within specific age intervals, and it is a good way too see when life is difficult or when survival is lower
draw the three survivorship curves (1,2,3) and explain each with an example
type 1 —> high survivorship until old age (ex. large mammals, humans, longer lived with maternal care)
type 2 —> linear decrease across the life as organisms are constantly increasing the chance of death throughout their life (ex. birds, often prey, medium position on the food chain)
type 3 —> no effort in parental care but produce lots of offspring (ex. trees, plants, fish)

what do deterministic models not account for
random events, all of the models are estimates
define per capita growth rates
r = (births - deaths) / total population (N)
what does r stand for
per capita growth rate
write the formula for population growth
population growth = rN
r = the per capita growth rate
N = the number of individuals in the initial population
list the two types of population growth
1) exponential growth
2) logistic growth
define, draw, explain and give examples of exponential population growth
exponential growth is theoretical growth rates without restrictions (no limit on resources, no competition, etc) and as an unsustainable growth pattern
J shaped curve
used for theory and in lab, not in real life
ex. bacteria population doubling in lab nutrient broth
calculate the growth rate from this scenario: a population has 20 rabbits. in the first month, 10 rabbits are born and 4 rabbits die. what is the population after one month, and what is the population after two months?
Equation: population growth (G) = rN
N (initial population) = 20
r = (births - deaths) / N
10 births and 4 deaths = 10-4= net +6 rabbits
—> 6/20 = 0.3 = r
growth G=rN
after 1 month, N(new) = N(previous) + G
N(1 month) = 20 + (0.3 × 20) = 26 rabbits after 1 month
N(2 months) = 20 + (0.3 × 26) = 34 rabbits after 2 months
define, draw, and explain logistic growth
logistic growth: a growth curve that recognizes that resources are limited
initially growth is almost exponential when populations are low and competition for resources is low
population growth slows as it reaches carrying capacity
k = carrying capacity
what is k
k = carrying capacity
write the logistic growth model
G = rN x ((k-N)/k) where:
G=growth
r=per capita growth rate
N=inital population
k=carrying capacity
define carrying capacity
k = carrying capacity
carrying capacity as the maximum population size that an environment can sustain
(k-N)/k describes the effect of limiting factors on an increasing population size
resources become more limiting as a population approaches k
the value of (k-N)/k gets smaller as a population approaches carrying capacity
give two examples of a logistic growth curve (one in nature, one in a lab)
lab - bacteria growth in a lab dish is exponential until at a certain point the space is at a maximum and competition for space and resources forces carrying capacity (k)
nature - harbor seals were hunted and had a low population until granted protection, then had exponential growth for a period before reaching carrying capacity (k)
what is the key impact of understanding logistic and exponential growth?
key that researchers can identify the sweet spot for growth of a population
intermediate point of density identified as a growing population is more resilient than a population at carrying capacity
what are the two density factors that regulate population size
1) density dependent factors
2) density independent factors
describe density dependent factors
intraspecific competition
interspecific interactions
ex. predator - prey relationships
define interspecific and intraspecific
inter - between two different species
intra - between two of the same species
describe density independent factors
abiotic factors
ex. weather, pollution, fires
can be predictable or stochastic
define and give an example of predictable and stochastic density independent factors
predictable: can be forecasted —> wet and dry seasons within a habitat
stochastic: random, unpredictable events —> fires, acute pollution events
give an example of a density dependent factor on song sparrows
as the density of female song sparrows increases, the average number of offspring per female decreases
this means that as there are more female song sparrowss, the amount of offspring per female decreases due to increased intra- and inter- competition of the song sparrows (for food, resources, ect).
density dependent
give an example of density independent factors on song sparrows
if a wildfire burns 80% of the trees and nests down in the enviornment, it would be a density independent, abiotic factor
sochastic example of density independent limiting factors
list the two types of demographic based population based models
k-selected
r-selected
describe the k-selected population demographic surviviorship model
k = carrying capacity
long lived
few offspring with high parental care and high likelyness that offspring will survive to adulthood and reproduce
population is maintained around carrying capactiy
most strongly controlled by density dependent factors
describe the r-selected population demographic survivorship model
r = per capita growth rate
small bodied
many offspring
little to no effort when it coms to parental care, low survival rates
almost exponential growth initially until crash
boom and bust pattern
most strongly controlled by density dependent factors
give an example of r-selected population dynamics
ex. aphid populations throughout the year
aphid graph across the year, low rates most of year, spike around spring and summer seasons
rapid (exponential) growth period with the maturation of plants and fruit in spring
aphids hatch out of eggs, reproduce, lay eggs, then die
whole life span is around 4-5 months, boom and bust pattern
density independent crash (abiotic)
describe the human population in relation to density dependent regulations
overcoming density dependent restrictions
shelter, crop and agricultural advancements, technology
medicine reduces death rates
describe the human population’s growth since the industrial revolution
exponential growth in the human population
what are current human population growth trends tied to
socio-economics more than density dependent restiction factors
list and draw the four age structure diagrams for human populations
1) rapid growth
2) slow growth
3) stable growth
4) regression?
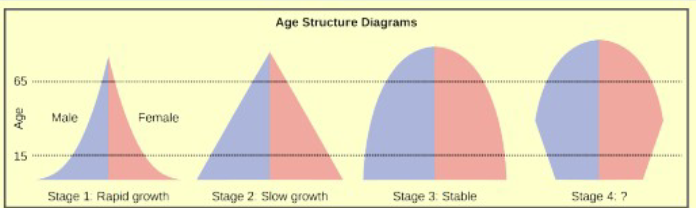
define community ecology
study of species composition and distribution, and the factors that effect them
list the practical applications of community ecology
1) conservation and management
2) controlling zoonotic diseases
3) optimizing agricultural yields
define ecological niche
the role of a species in an ecological community, the array or sum of resources that an organism makes use of
define and explain the competitive exclusion principle
no two organisms that exist in the same ecological niche at the same time can coexist, one will outcompete the other
give a lab and natural example of the competitive exclusion principle
lab - two bacterias grown seperately will thrive on their own, but when grown together and competing for resources, one outcompetes the other
natural - songbirds competitively exclude one another and occupy highly specific ecological niches
state the example predator prey relationship
the predator and prey relationship between the lynx and the hare
density dependent factor
describe the pattern and dynamic between the population of the lynx and hare across time (predator-prey relationship)
population dynamics are in concert with one another
occilation with one another
lag effect with peaks and valleys
note: carrying capacity also changes throughout time
list the types of predator-prey relationship evolutionary adaptations and examples
1) mechanical defenses against herbivory - thorns on bush
2) chemical defenses against herbivory - secondary metabolites
3) camouflage as a defense - walking stick, cameleon
4) aposematism / warning coloration - poison dart frog
5) mimicry - fly that looks like a wasp
define symbiosis
an interaction between two species
list the types of symbiosis
1) commensalism
2) mutualism
3) parasitism