APES Unit 3
 Call Kai
 Learn
 Practice Test
 Spaced Repetition
 Match
 Flashcards
 Knowt Play
1/30

There's no tags or description
Looks like no tags are added yet.
31 Terms
K-selected species
low growth rate
high survivability
Type 1 and 2 growth

r- selected species
high growth rate
low survivability
Type 3 growth

Type 1 survivorship
low early death rate
K-selected
high parental care
ex: humans, elephants
Type 2 survivorship
circumstantial
constant death rate
ex: birds, rodents, lizards
Type 3 survivorship
high death rate early in life
low parental care
r-selected
fish, insects, frogs
carrying capacity (K)
the size of a population that the available resources can sustain indefinitely

carrying capacity graph
area pop increases
overshoots K
food becomes limiting/K falls
pop stabilizes @ new K
drought occurs, K drops
drought breaks, K stabilizes up, but lower than initially
total fertility rate (TFR)
average # children born to a woman during her life
factors affecting TFR
Medical care
Jobs for women
Death (infant)
Literacy in women
Labor (need for child labor)
Birth control access
“Moms Just Don’t Like Labor & Birth”
replacement level fertility
average # kids a couple must have to replace themselves
2.1 currently
Infant Mortality Rate (IMR)
# babies per 1000 who pass before 1st birthday
Factors influencing pop dynamics
birth/death rates
fertility
life expectancy
immigration/emigration
family planning
population density
total pop/total area
pop doubling time
70 / % growth rate
growth rate (r)
% birth rate - % death rate
[(total in) - (total out) / total pop] x 100
CBR-CDR/10
Malthusian theory
human pop is growing exponentially while food grows linearly
→ demand for resources will soon surpass supply
density dependent limiting factors
more resources = more pop growth
ex: predation, disease, parasitism
density independent limiting factors
conditions that affect the size and growth rate of a pop regardless of how crowded or dense it is; abiotic
-→ natural disasters, human activities
biotic potential
the maximum rate a pop can increase when conditions are ideal
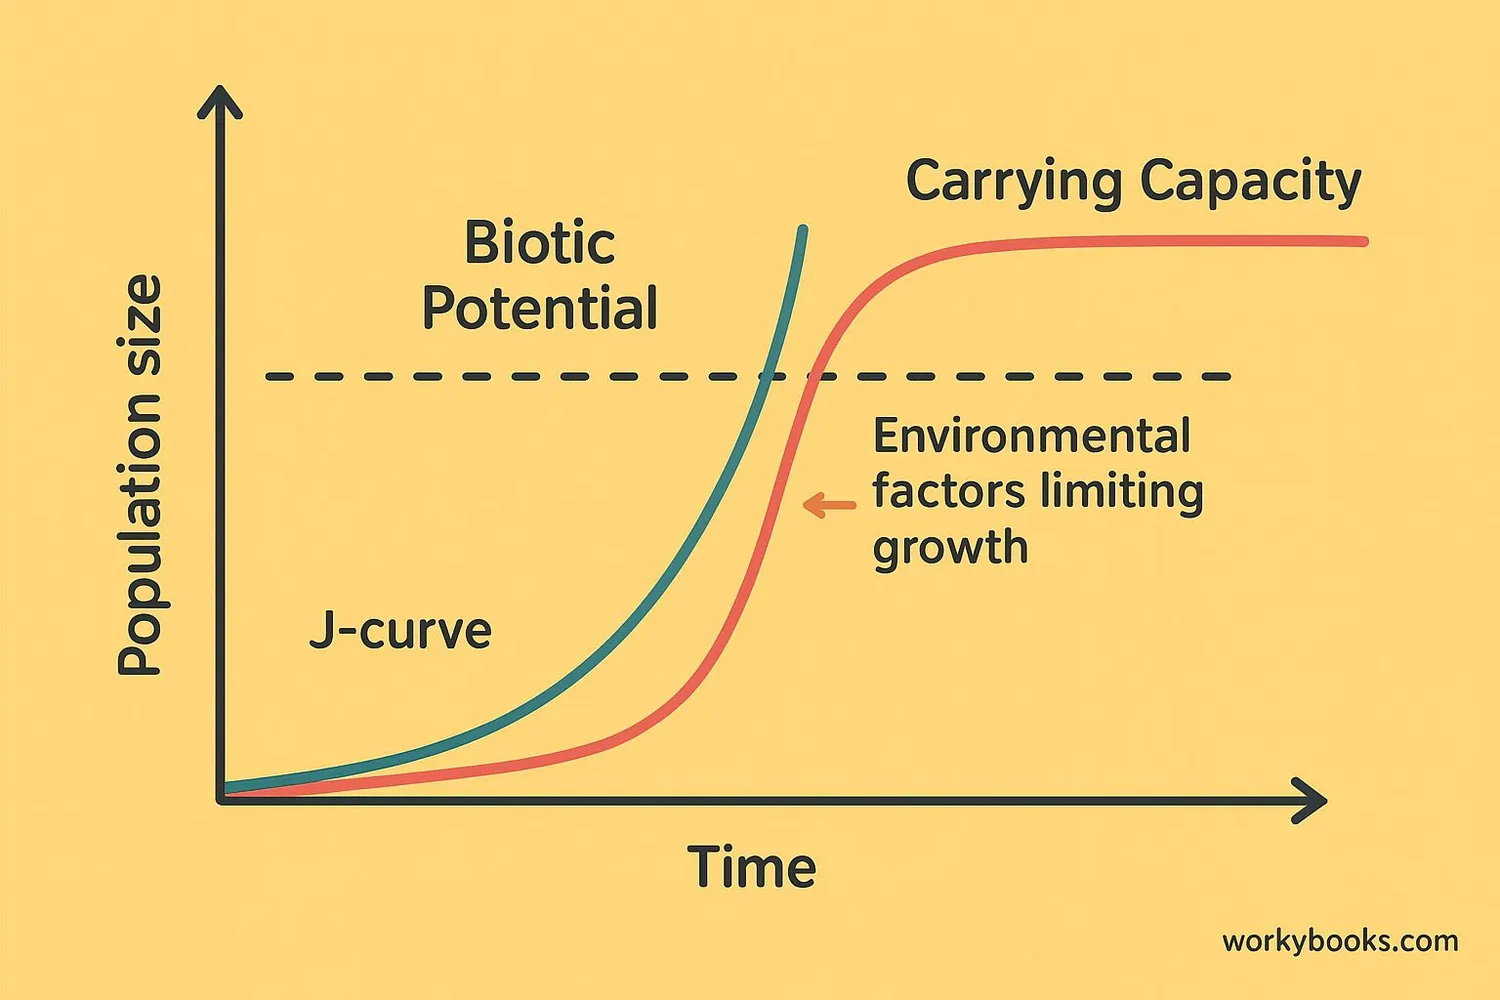
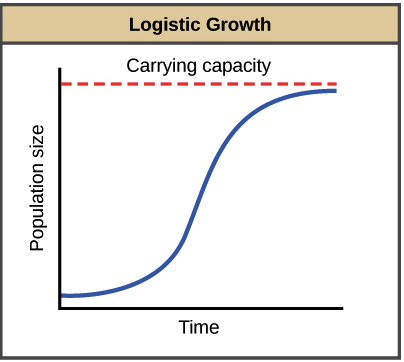
logistic growth
when pop growth rate slows down as size approaches max limit imposed by scarce resources

Stage 1 age structure
slow growth
high birth, high death
short life expectancy
kids in workforce

Stage 2 age structure
rapid growth
high birth, low death
no fam planning

stage 3 age structure diagram
stable growth
low birth, low death
more access to birth control
educated women

stage 5 structure diagram
declining growth
death > birth
deaths happen later
demographic transition
the transition from higher to lower birth/death rates as development occurs
% change
(new-old) / old x 100
population change
(# births + immigrants) - (# deaths + emigrants)
pre industrial
poor medical care
unreliable access to food/water
low access to birth control
transitional
industrialization starts
improved medical care & food production
little fam plannning
industrial
increased job opportunities
increasing access to education
increased access to birth control
post-industrial
aging pop
high pop
rising unemployment (retiring)