Unit 2.1-2.3 AP Statistics Quiz
 Call Kai
 Learn
 Practice Test
 Spaced Repetition
 Match
 Flashcards
 Knowt Play
1/26

Earn XP
Description and Tags
10 matching, 8 mcq, 1 frq
27 Terms
Uni-variate Data
Data collecting observations on a single variable, so only 1 variable matters. Example: Hair color, height, gender, eye color
Bi-variate Data
Data collecting paired observations on 2 different variables, so 2 variables matter. Example: height and gender, hair and eye color
Qualitative (Categorical) Data
Data grouped into non-numeric categories or attributes. Example: Grades (freshman, junior) and zip code
Quantitative (Numerical) Data
Numerical measurements or counts, can calculate average. Example: length, width, psi, height, house number on a street
Discrete Data
Quantitative data taking on distinct, separate, or countable values. May be finite or infinite and whole numbers. Example: Y value in step function

Continuous Data
Quantitative data that can take on any value within a continuous range, measurable but not countable. Example: X value in step function.
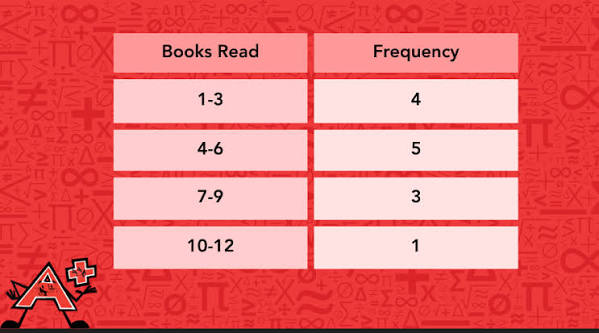
Frequency/Frequency table
Total count of occurrences for a specific value or category
Relative Frequency
The proportion or percentage of total observations belonging to a category.
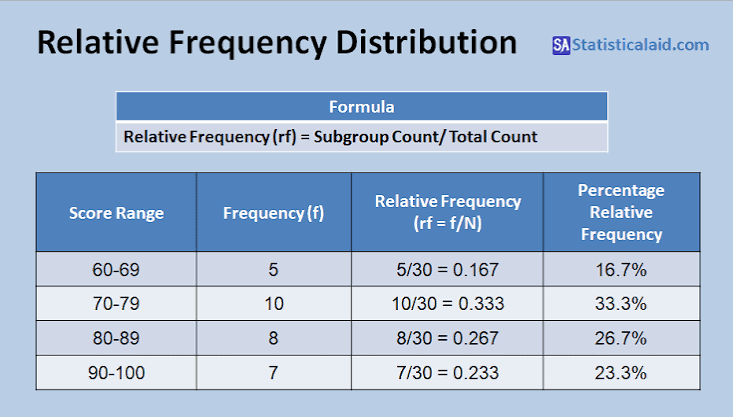
Relative Frequency table
Table displaying raw counts or relative percentages across categories
C.U.S.S (have labels)
C- Center (median or mean), U - Unusual features (outlier, gap, cluster in data), S - Shape (Way the graph appears: normal, skewed, uniform, [+,-]), S - Spread (How spread data is, usually range or standard deviation)
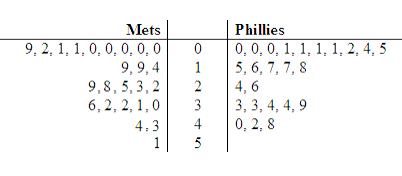
Stem and Leaf Plot
Splits quantitative data values int two distinct parts. Stem is leading digit, leaf is second or third digit, goes from smallest to largest on right side and largest to smallest on left.
Analyzing data
Minimum (lowest value in data set), Quartile 1 (# that marks 25% of data), Median (middle number of data), Quratile 3 (# that marks 75% of data), Maximum (high value in data set), IQR (Q3 #-Q1 #), something is skewed right is tail is on right side (vice versa for left)

Box Plot
Step 1: Do the 5 number summary (Analyzing Data), Step 2: Draw the box (middle 50%), Step 3: Whiskers (25% extension), Step 4: Outliers. If presented vertically, turn horizontally

Bar Graph
A visual representation of categorical data using rectangular bars proportional to frequencies or percentages.

Histogram
Graph that shows how quantitative (numerical) data is spread out and grouped across continuous ranges. To find the median in a histogram: Step 1 - Find halfway point between the frequency value or find the relative frequency of 50%. In picture it’s 31, so 31/2 = 15.5, so median would be between 75-80 feet. To graph a histogram: Step 1 - Find a good bin size (how wide), Step 2 - place each data point into bin, Step 3 - The number of data points in the bin corresponds to frequency

Pie Chart
Circular graph divided into proportional sectors reflecting relative frequencies
Area Principle
A data visualisation rule stating that the visual area occupied by a graphic representation must correspond directly to the proportion of data represented
Sample mean (x with the line on top)
The calculated arithmetic average of a subset/sample
Population mean
The true mean value across an entire population
Median
The middle value when data points are arranged in ascending order
Outlier
An extreme value that heavily influences the mean and standard deviation while having minimal impact on the median
Range
Total spread calculated as the difference between maximum and minimum values
Standard Deviation
A measure reflecting the typical distance or deviation of observations from the mean
Sample standard deviation (S)
Standard deviation computed using n - 1 degrees of freedom in the denominator
Population standard deviation (o or sx)
Standard deviation computed across an entire population
Unimodal
1 peak
Bimodal
2 peaks