Stats Test 2
 Call Kai
 Learn
 Practice Test
 Spaced Repetition
 Match
 Flashcards
 Knowt Play
1/73

There's no tags or description
Looks like no tags are added yet.
74 Terms
Why does a column of population data values contain more information about the population than a column of data values?
A column of population data values has more data values than a column of sample data values
In regard to normally distributed data values themselves, what is the importance of knowing the value of the population mean in the science of statistics?
Most of the data values are clustered close to the value of the mean
In the common, real-world practice of statistics, is it ever possible to know the true value of the population mean?
All these other choices
The statement ‘On average, Americans spend around 4.5 hours per day on their phone.’ has what interpretation in the process of abstraction?
That all American spend 4.5 hours
Two common statistical estimators of the population mean are the sample average and the confidence interval. Which one of these statistics is more useful to give information about the value of a population mean?
Confidence interval, as it shows how far the mean might be from the average.
Why is the confidence interval method the best method to get an interval estimate of the population mean?
It uses the most information from the distribution of the data values.
Select two choices below that make up the two parts of a margin of error in a confidence interval?
The level of confidence in the confidence interval method.
The standard error of the sample average.
The lower and upper confidence limits for a confidence interval can be seen in a schematic curve. The two confidence limits are just the x-values of a middle body area in a schematic curve.
True.
When the number of data values is increased, how does the width of the confidence interval change?
Narrows, as the standard error of the sample average gets smaller.
Will every confidence interval contain the value of the population mean?
No, only the confidence level proportion of the time
Is the following a true statement? ‘A confidence interval is used to infer the value of a sample average’.
No, as it is used to find the value of the population mean.
Is the following a true statement? ‘The population mean must be known to calculate a confidence interval’.
No, as finding the value of the population mean is the goal.
Click two of the following choices as the reasons why the method of hypothesis testing is needed.
To learn the reasonableness that the null value is the value of the population mean.
To answer if the null value is less than, or greater than, the population mean.
In the statistical method of hypothesis testing, p-value gives the size of which area(s) in a schematic curve?
The tail area(s) from the value of the test statistic.
In the statistical method of hypothesis testing, what happens to the Type-II Error when the Type-I Error is decreased?
The Type-II Error increases.
In the statistical method of hypothesis testing, please select two choices that are the parts of Step 2: Analyze.
Find the p-value from the test statistic and the z,t-table.
Calculate the test statistic using the z,t-equation.
In the statistical method of hypothesis testing, please select two choices that are the most commonly used approaches to make an inference about the value of a population mean.
The p-Value approach.
The Critical Value approach.
In the statistical method of hypothesis testing, please select two choices that are the purposes of Step 1: Theorize.
Use the schematic curve to analyze this situation.
Find the critical value(s) for this situation.
For the method of two-sample hypothesis testing, in a dependent two-sample situation the numerator of the t-equation contains the mathematical distance between the sample average and the hypothesized value of the population mean. Which choice below gives this distance?
Distance = (d−0).
For the method of two-sample hypothesis testing, please select two of the choices below that are the most significant ways that independent two-sample situations differ from dependent two-sample situations.
There are twice as many sources of variation.
The two population spreads can be the same or different.
For the method of two-sample hypothesis testing, Levene's equality of variance test is interpreted using the p-value approach. What is the null hypothesis of Levene’s test?
The two population variances are equal (σ21−σ22=0).
A nutritionist wonders whether two different soft drinks have the same effect on weight gain in teenagers who consume a lot of soft drinks. To find out, she randomly selects 50 teenagers and asks them to drink only soft drink #1 for six weeks. She then measures the change in weight for each teenager. Next, she asks the same teenagers to drink only soft drink #2 for six weeks, and measures the change in weight for each teenager.
This sampling method gives a dependent two-sample situation between the two types of soft drink.
For the method of two-sample hypothesis testing, what question is asked in the method to determine dependency between the two columns of data values?
Where did the individuals in the second column come from?
For a dependent two-sample situation, how does subtracting the two dependent data values remove the dependency?
Two of these other answers.
For a dependent two-sample situation, select two choices that are appropriate situations for a dependent two-sample t-test.
Random sample of twins in different grades in high school.
Random sample from one elementary school and a matched sample from another elementary school.
For a dependent two-sample situation, why does the value in the null hypothesis always equal zero (0)?
That indicates that the two population means are equal.
For an independent two-sample situation, what is the appropriate degrees of freedom when the population variances are equal / not equal?
DF = Pooled / Satterthwaite’s.
In the ANOVA table, how many hypothesis tests are there / what approach is used to make conclusion(s)?
One hypothesis test / The p-value approach
In the ANOVA table, what is the null hypothesis / the alternative hypothesis
Populations means are equal / Population means are not equal.
The ANOVA Fraction is the basis of the ANOVA table. What is the basis for the ANOVA Fraction?
The sampling distribution of the sample average.
In the ANOVA Table, what concept of testing does it follow for analyzing population means?
An overall hypothesis test of all population means.
In the ANOVA table, there are four assumptions to be met. What is the focus of the first two assumptions / the last two assumptions?
Concerns the data values / Concerns the populations
Anova table
overall test of the population mean to find out if their equal or not
Shapiro Wilk Test (p-value)
Normality, normal= p>0.05
Levene’s Test
Variances
a. 0.05< p value = population variances are equal
b. p value < 0.05= population variances are NOT equal
In the ANOVA table, the bottom row is a check row for the degrees of freedom and the sum-of-squares? What information about spread is given in Row 1 / Row 2?
About the sample averages / About the data values
In the ANOVA table (shown below), which column gives the raw measure of spread / the standardized measure of spread, for each row?
The Sum-of-Squares / The Mean Squares.
DF for Anova table
a. Model: k-1
b. Error: k(n-1)
c. Total: N-1
In the ANOVA table (shown below), are the degrees of freedom correct for a situation with three populations and ten data values from each population?
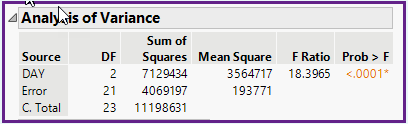
No, because the values should be DFerror = 27 and DFc total = 29
In the ANOVA method, how does the Tukey table determine if two population means are equal?
The difference in the two sample averages is less than the MSD.
What was the original purpose of the ANOVA table?
To make it easy to calculate the F0 test statistic by hand.
In the ANOVA table, the conceptual ANOVA fraction is shown below. How is this fraction modified to a mathematically equivalent form that is used in the ANOVA table?
Multiply by n/n.
Process of Abstraction
a method to pull out real world information relevant to the statistical world to aid in solving a problem. Information irrelevant to the statistics is ignored
Confidence Interval of the Mean
An estimate of the value of the population mean, expressed as a mathematical interval to give the uncertainty in the estimate
Confidence Region
The middle body area of a Schematic Curve for a confidence level
Confidence level
The size of the confidence region for a confidence interval
Significance Region
the two tail areas of a Schematic Curve for a confidence interval
Significance level
the size of the significance region for a confidence interval
Critical Values
A pair of standardized values (z-scores or t-values) that separate the confidence region from the significance region
Margin of Error
One half of the spread of a confidence interval expressed in x-values
Hypothesis Testing
a statistical method starting with a hypothesized value for the population mean, then comparing information from a sample with information from probability to get information about the value of the population mean
Critical Values (Hypothesis Testing)
the z scores or t values that separate the acceptance region from the rejection region
Type I Error
When the conclusion of a hypothesis test is to reject the null hypothesis, but the null hypothesis is actually true
Type II Error
When the conclusion of a hypothesis test to to not reject the null hypothesis, but the null hypothesis is actually not true
p-value approach: Larger than alpha
do not reject null
p-value approach: smaller than alpha
reject the null
Dependent Samples
when individuals in the first sample (the first column) are related in the same fashion to the individuals in the second sample (second column)
Independent Samples
when the individuals in the first sample are not related to the individuals in the second sample
Levene’s Equality of Variance Test
a hypothesis test to determine if two population variances should be considered to be equal or not
Pooled Sample Variances
a statistic combining several sample variances together to get one, better estimate of the common population variance
Pooled Degrees of Freedom
the degrees of freedom of a pooled sample variance found by adding together the degrees of freedom of the individual sample variances
Welch’s Approximation
A simple and conservative but not accurate method to approximate the appropriate degrees of freedom in the two independent sample case when the population variances are not equal
Satterthwaite Approximation
a more accurate method to approximate the appropriate degrees of freedom in the two independent sample case when the population variances are not equal
Anova Method: H0
population means are equal
Anova Method: H1
population means are not equal
ANOVA close to 1:
one population mean
ANOVA greater than 1:
more than one population mean
Wide View
where the data values being studied are arranged into several columns with one column for each population
Long View (for computers)
where the data values being studied are arranged into one column in a data set
Response Variable
the variable in a data set in the long view that has continuous data values measured from the individuals in the study
Factor Variable
the variable in a data set in the Long View that has categorical values giving the name of the population of each data value
ANOVA Appropriate Assumptions
Randomness
Normality
Independence
Equal Variances
Two pieces of information must be known to use the t-distribution to find the probability of an event. What are those two pieces of information?
Sample standard deviation / Degrees of freedom.
For the statistical method of hypothesis testing, what is the appropriate situation to use the t-distribution?
When the population standard deviation is not known.