Principles of Data Science I Midterm
 Call Kai
 Learn
 Practice Test
 Spaced Repetition
 Match
 Flashcards
 Knowt Play
1/32

There's no tags or description
Looks like no tags are added yet.
33 Terms
Confounders: definition, stratify/regression/sample
A third variable that influences both the treatment (or exposure) and the outcome, creating a misleading association between them.
Causal Inference: treatment and control groups
The process of determining whether and how much one variable actually causes a change in another, rather than just being correlated with it.
Selection Bias
The treatment group receives the intervention being studied; the control group does not, giving a baseline for comparison. The difference in outcomes estimates the intervention’s effect.
DAGS
Systematic differences between the sample and the target population that make results from the sample unreliable to generalize.
Simpson’s Paradox
A trend that appears in every subgroup reverses or disappears when the groups are combined, usually because of a confounding variable.
RCTs
Participants are randomly assigned to treatment or control, so groups are alike on average and confounders are balanced out. This is the gold standard for causal claims.
Observational Studies
Data collected without the researcher assigning treatments, so groups may differ in ways that confound results. They can show association, but causal claims require extra assumptions.
Natural Experiments
Situations where an outside event or rule (a policy change, lottery, or geographic cutoff) assigns people to groups in a way that is as-good-as-random, letting researchers study causal effects without running an experiment.
Curse of Dimensionality
As the number of variables grows, the data become increasingly sparse, so you need exponentially more observations to find reliable patterns.
Algorithms vs. Inference
_____ focus on getting good predictions or results, whereas _____ focuses on drawing conclusions about the underlying process and quantifying uncertainty about them.
Causal vs. Actuarial Gaps in Knowledge
Actuarial knowledge tells you what outcomes tend to occur (rates and patterns), while causal knowledge tells you why they occur and what would happen if you intervened. Knowing the former doesn’t give you the latter.
Prediction vs. Estimation/Understanding
Prediction aims to forecast outcomes accurately, even if the model is a black box; estimation/understanding aims to quantify how specific variables affect an outcome and why.
Distributions: continuous vs. discrete
A description of all the possible values a variable can take and how likely each one is.
(Distributions) PMF and PDF
Variables that can take any value in a range (e.g., height, time). Probabilities are described by a probability density function (___), and the probability of any exact value is zero.
Variables that take countable, separate values (e.g., number of heads in 10 flips). Their probabilities are described by a probability mass function (___), which gives the probability of each exact value.
probability (Distributions)
A number between 0 and 1 that measures how likely an event is to occur.
mean
The ____ is the average
median
the _______ is the middle value when data are ordered. more resistant to outliers than the mean.
mode
the most frequent value
variance
______ measures the average squared distance of values from the mean
standard deviation
variance square root, giving spread in the original units.

Normal distribution (and formula)
A symmetric, bell-shaped distribution defined by its mean and standard deviation, where values cluster near the center and taper off equally in both directions.
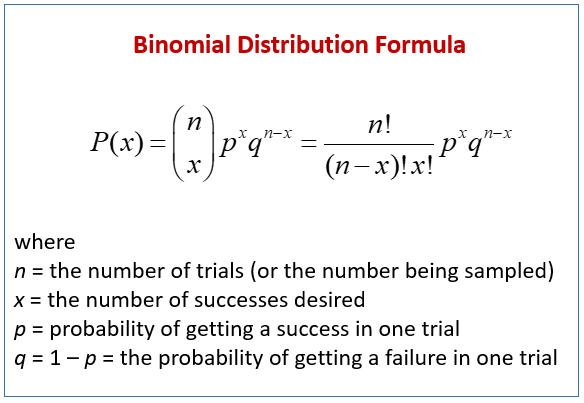
Binomial distribution (and formula)
The distribution of the number of successes in a fixed number of independent trials, each with the same probability of success (e.g., number of heads in 10 coin flips).
Central Limit Theorem
The distribution of sample means approaches a normal distribution as sample size grows, regardless of the shape of the original data’s distribution.
Sample vs. Population/Theoretical
The population (or theoretical distribution) is the full group or underlying process you care about, while a sample is the subset you actually observe.
Empirical Population
The distribution of values observed in the sample.
volunteer (Selection Bias)
People who choose to participate differ systematically from those who don’t (e.g., more motivated or health-conscious).
nonresponse (Selection Bias)
People who don’t respond to a survey differ in meaningful ways from those who do, skewing the results.
survivor bias (Selection Bias)
Focusing only on cases that ____ some process while ignoring those that didn’t, leading to overly optimistic or wrong conclusions (e.g., studying only the returning WWII bombers).
inspection paradox (size bias) - selection bias
Larger or longer-lasting items are more likely to be sampled, so the sample average overstates the true average (e.g., the average class size students experience is larger than the average class size the school reports).
berkson’s paradox (selection bias)
Selecting a sample based on a condition (e.g., being hospitalized) can create spurious associations between variables that don’t exist in the general population.
selecting on the dependent variable (selection bias)
Choosing cases based on the outcome you’re studying (e.g., only successful companies), which makes it impossible to tell what actually causes the outcome.
Benford’s Law
In many real-world datasets, the leading digit is 1 about 30% of the time, with higher digits appearing progressively less often. It is used to detect fabricated or manipulated data.
“All models are wrong, but some are useful”
Statistician George Box’s point that models are simplifications of reality and never perfectly correct, but they can still be valuable for understanding and prediction.