Biostats test
 Call Kai
 Learn
 Practice Test
 Spaced Repetition
 Match
 Flashcards
 Knowt Play
1/63

There's no tags or description
Looks like no tags are added yet.
64 Terms
Mean preferred for what kind of data
continuous data that is normally distributed
Median preferred for what kind of data
Ordinal or continuous data that is NOT normally distributed
Mode preferred for what kind of data
Nominal data
Descriptive statistic
present, organize, and summarize data in a basic sense - “One dimensional”
Inferential statisitcs
test for differences or relationships within a study sample - “result” or “outcome”
What would show data set normally distributed
Mean, median and mode are the same
Discrete data include
Nominal and ordinal
Nominal data
2 or more mutually exclusive groups (yes/no, dead/alive, event/no event)
Ordinal
intrinsic order but no equal interval in between (pain scales, NYHA HF class, CHA2DS2-VASc)
Continuous data
Interval and ratio
Interval
measurable data with equal interval WITHOUT absolute zero (BMI, IQ, CrCl)
Ratio
measurable data with equal interval WITH absolute zero (height, weight, HR, BP, length of stay)
Null hypothesis
there is no difference between groups
What is alpha value?
We accept % chance of the results observed are due to chance (false positive)
Confidence interval for ratios (HR, Odds ratios)
If it does NOT include 1, then it is statistically significant
Confidence internval for continuous values
If it does not include 0, then it is statistically significant

Ordinal

Nominal
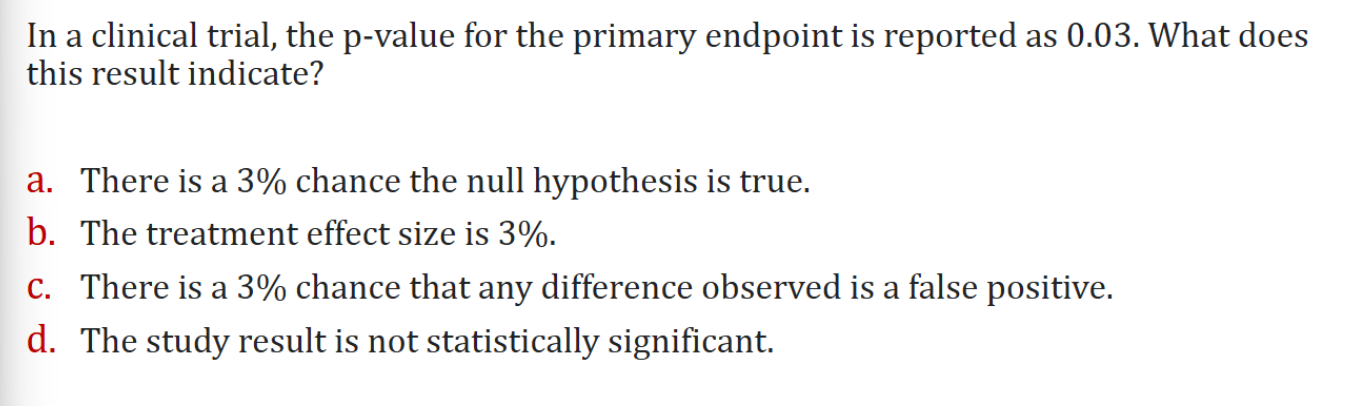
C

D
Descriptive epidemiologic
Describe distribution of disease in the population
Experimental epidemiology
Planned experiment to confirm causal relationship
Analytical epidemiology
Relationship between exposure and disease
How is RCT different from observational study
RCT: measure efficacy under ideal and controlled circumstances - drug causes outcomes
Observational: real world circumstances, effectiveness - drug is related to outcomes
Why do we need observational studies
Better generalization: with more population study and better size, more indications, longer follow-up, cheap
Regulatory, marketing, legal and clinical purpose
Supplement data from premarketing study: new patient population, DDI, drug-disease, relative to other drug used for the same indication, undetected benefits and adverse effects, drug utilization patterns, overdose, economic implications
What kind of experimental setting is observational studies can use
Cohort and case-study
Prevalence
prevalent case = both new and pre-existing

Incidence risk
New cases (no exposure, no outcome)/at risk

Incidence rate

Odd ratio

How to measure ratio effects
Risk ratio, rate ratio, odd ratio, hazard ratio
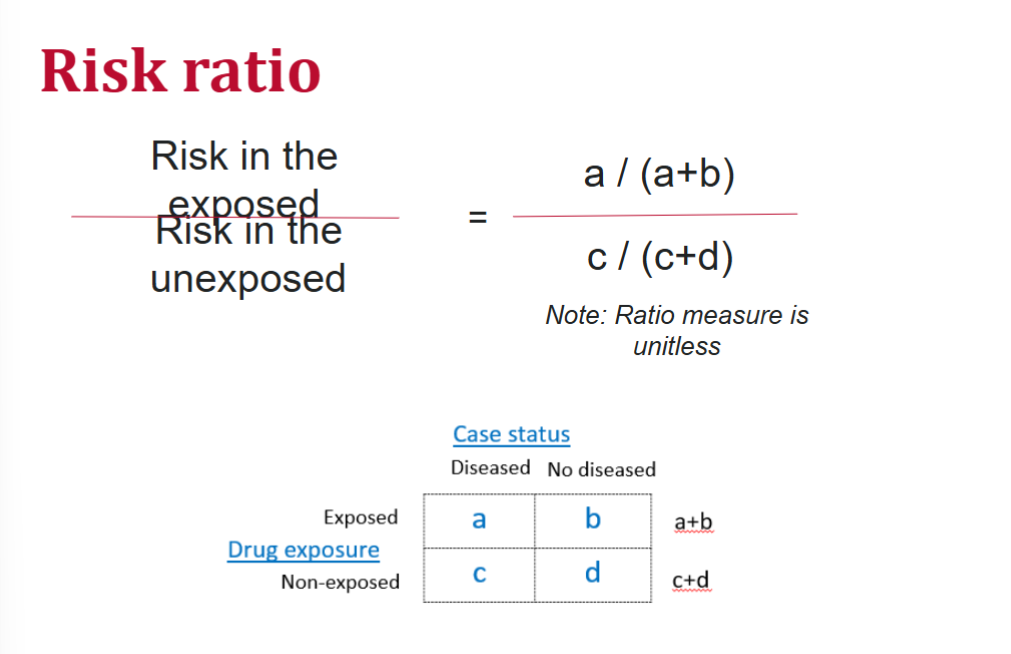
Risk ratio
If RD (risk difference) =0 : no difference (same in both groups)
• If RD >0 : (+) risk in the exposed is greater than risk in the unexposed
• If RD <0 : (1) risk in the exposed is lower than risk in the unexposed
Rate ratio
CUMMULATIVE event rate

Hazard ratio
instantaneous event rate, i.e., the probability of event at a particular given point in time
HR=1 (no association)
HR >1 (increased risk)
HR <1 (decreased risk)
Number needed to treat (NNT)
Number of patients needed to treat to gain additional beneficial effects of a drug intervention
NNT= 1/Risk difference or 1/Rate Difference
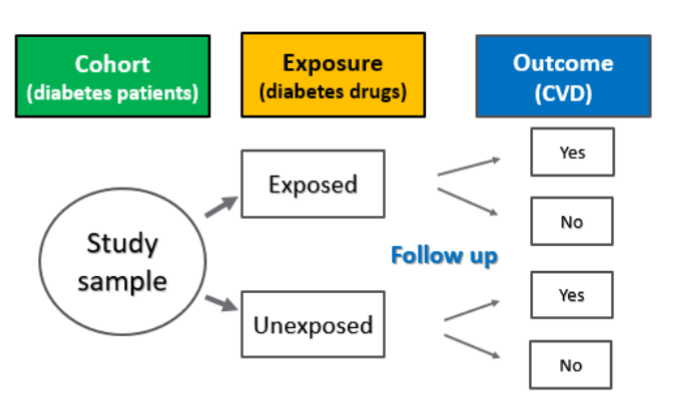
What is a cohort?
Well-defined group of subjects
• Followed an at-risk population over time from exposure
Closed cohort = fixed cohort
No subjects are added after cohort is formed
Everyone (A-G) starts at the same time (t0) and is followed until t1 unless an event occurs.
Open Cohort - dynamic
Subjects can enter and exit; study population is constantly changing.
Individuals in the cohort start at a different time
Individuals in the cohort leave at a different time
When is a cohort study warranted?
When the (alleged) exposure is known
• When exposure is rare and incidence of disease among the exposed is high
• When adequate funding for prospective cohorts is available
• When the time between exposure and disease is relatively short (induction and latent)
Drug exposure definition
Exposure is always assessed before outcome
• Unit of analysis
o At the patient level if drug exposure occurs at a single point in time (e.g., use during hospital stay)
o At the patent-time level if drug exposure status changes over time
Exposure during induction/latent period should NOT be included - additional exposure doesn’t affect the outcome
Users with prevalent exposure
patients who have been taking drugs before they enter the study
Users with incident (new) exposure:
patients who initiate drugs at study entry
Problem with prevalent user design
• Underestimate outcome events
o New users who have early events are automatically removed before cohort entry under prevalent user design
o Prevalent users are “survivors” of the early period of drug therapy,thereby having a lower risk, compared to new users
cons of cohort studies
More expensive, inefficient for rare outcome, losses to f/u
Case-control study
Cases and controls are defined based on whether patients have the outcome of interest
Retrospective
only one outcome is studied
When is a case-control study warranted?
• Disease being studied is rare (prevalence < 10%)
• Exposure data are difficult or expensive to obtain
• Little is known about the disease
• Time between exposure and disease (i.e., induction and latent period) is long
How are cases defined and selected
• Cases should represent the target (source) population with the disease of interest
• Cases should be well-defined before measuring exposure
• Cases should be incident cases rather than prevalent cases
Select controls for case
Controls are subjects without the disease of interest
• Controls should come from the same population from which cases arise
• Controls should be selected similar to cases on key factors (e.g., gender and age)
• Selection of controls should be independent of the key exposure
Types of controls
• Convenient control: Hospital/clinic controls, Neighborhood or family/friends controls
• Population control: Random sample
Hospital-based controls criteria
Controls are individuals without the disease of interest
Controls are unrelated to exposure being studied
Controls have similar referral patterns as the cases
Population-based controls

What is matching in case-control studies?
Make cases and controls similar to each other in variables
• Variables matched are key variables associated with exposure and outcome (e.g., age and gender)
Matching increases statistical precision
o Matching leads to a narrower confidence interval (CI) of the association estimate, ensures similar numbers of cases and controls in confounder strata
Potential limitations of matching

Sources for exposure measures

Can incidence or absolute risk/rate be calculated in case-control?
No; only odds ratio can be calculated
Cons of case control studie
Case-control studies increase the chances for introducing bias
• Case-control studies cannot calculate incidence and absolute risk or rate
• Case-control studies cannot do survival analysis (not follow patients over time)
• Case-control studies cannot evaluate multiple outcomes simultaneously
• Selection of suitable controls is difficult in case-control studies
Surrogate
a biomarker that is used as a substitute for a clinical endpoint that predicts trial outcome
Clinical outcome
a characteristic or variable that reflects how a patient feels, functions, or how long a patient survives
Composite outcome
a group of clinical outcomes (usually morbidity and mortality-related) that are combined into a single analysis to increase power and ability to find a difference
Statistically significant vs. clinically significant
Statistically significant: the difference that exists between study groups is unlikely
to be explained by chance
• Clinically significant: the difference that exists between study groups is substantial
enough to be clinically useful
Null Hypothesis of Non-inferiority
New treatment is not noninferior to active control by specified noninferiority margin
Confounding Factors
Guidance for patients on any lifestyle aspects they should keep constant
Post Hoc Analyses
All analysis methods should be defined a priori
• Post-hoc analyses should be specified as such and interpreted as correlation, not causation