Ecology Exam 2 pt 3 (Lord Pls) (Chapters 8, 9, and 11)
 Call Kai
 Learn
Learn Practice Test
 Spaced Repetition
 Match
Match Flashcards
 Knowt Play
1/55

There's no tags or description
Looks like no tags are added yet.
Name | Mastery | Learn | Test | Matching | Spaced | Call with Kai | Chat |
|---|
No analytics yet
Send a link to your students to track their progress
56 Terms
Unitary organisms
Unitary vs. Modular Organisms (8.1)
Have a predictable form and life cycle (most animals):
Modular organisms
Unitary vs. Modular Organisms (8.1)
Grow by adding repeating units; made of parent plants and clones (most plants, corals):
Geographic Range
Distribution (8.2)
The spatial location where a species is found:
Random, Uniform, and Clumped (Aggregated)
Distribution (8.2)
What are the three Spatial Patterns?:
Random - equal probability of being anywhere
Distribution (8.2)
Define this spatial pattern:

Uniform - evenly spaced out due to competition/territory
Distribution (8.2)
Define this spatial pattern:

Clumped (Aggregated) - Grouped together in patches
Distribution (8.2)
Define this spatial pattern:

Abundance
Abundance & Density (8.3)
Total number of individuals in a population:
Population Density
Abundance & Density (8.3)
Number of individuals per unit area/volume:
Ecological Density
Abundance & Density (8.3)
Density calculated relative to available suitable habitat space (since habitats aren’t uniform):
Sessile (Stationary) Organisms
Sampling Populations (8.4)
Sampled using sample plots/quadrats:

Mobile Organisms
Sampling Populations (8.4)
Sampled using capture-recapture techniques or relative abundance signs (tracks, vocalizations):

Pre-reproductive, Reproductive, Post-reproductive
Age, Stage, and Size Structure (8.5)
Divided into what 3 ecological periods?:
Growing population
Age, Stage, and Size Structure (8.5)
High percentage of young individuals:

Declining population
Age, Stage, and Size Structure (8.5)
High percentage of older individuals:

Starts near 1:1 at conception/birth. - Shifts over time due to age-specific mortality rates.
Sex Ratio (8.6)
Where is sex ratio usually seen?:
Dispersal
Dispersal & Population Dynamics (8.7 & 8.8)
Movement of individuals across space (passive via wind/water, or active):

Migration
Dispersal & Population Dynamics (8.7 & 8.8)
Round-trip, directional movement between locations:

Spatial distribution, population density, birth/death rates
Dispersal & Population Dynamics (8.7 & 8.8)
What do dispersal dynamics drive?:
Non-native species introduced to new areas that negatively impact native species and ecosystems.
Invasive Species (8.9)
Define invasive species:
Exponential Growth
Population Growth (9.1)
Occurs when births exceed deaths in an ideal environment w/o limiting factors; represented as continuous:

Intrinsic Rate of Increase ( r )
Population Growth (9.1)
The difference between instantaneous per capita birth rate (b) and death rate (d):
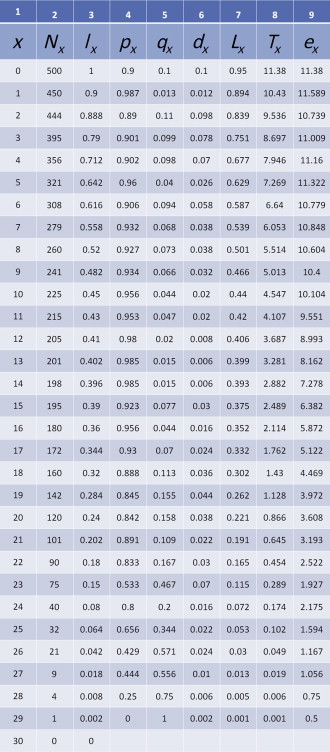
Life Table
Life Tables (9.2 & 9.3)
An age-specific summary of mortality and survival within a population:
Cohort (Dynamic) Life Table
Life Tables (9.2 & 9.3)
Follows a group of individuals born at the same time from birth until all have died:

Time-specific (Static) Life Table
Life Tables (9.2 & 9.3)
Samples a population at a single point in time to determine the age distribution across classes:

Type I Curve
Mortality and Survivorship Curves (9.4)
High survival rate throughout life; high mortality late in life (e.g, humans, large mammals):

Type II Curve
Mortality and Survivorship Curves (9.4)
Constant mortality/survival rate throughout all age classes (e.g, birds, reptiles):

Type III Curve
Mortality and Survivorship Curves (9.4)
Very high mortality in young age classes, but high survival for those who reach adulthood (e.g., fish, invertebrates, plants):

Gross Reproductive Rate
Birthrate & Net Reproductive Rate (9.5 & 9.6)
Total average number of female offspring born to a female over her lifespan:
Net Reproductive Rate (R0)
Birthrate & Net Reproductive Rate (9.5 & 9.6)
Average number of female offspring produced by a female during her lifetime, taking into account age-specific survival rates:
Equal to 1
Birthrate & Net Reproductive Rate (9.5 & 9.6)
Population is stable if R0 is —:
More than 1
Birthrate & Net Reproductive Rate (9.5 & 9.6)
Population is growing if R0 is —:
Is less than 1
Birthrate & Net Reproductive Rate (9.5 & 9.6)
Population is declining if R0 is —:
Combines age-specific survival/birth rates to project future population size/age structure
Population Projection Table (9.7)
Define population projection table;
Finite Rate of Increase
Population Projection Table (9.7)
The discrete rate of population growth from one time step to the next:
Demographic Stochasticity
Stochastic Processes (9.8)
Random variation in birth and death rates among individuals year to year:

Environmental Stochasticity
Stochastic Processes (9.8)
Random variations in environmental conditions (weather, food, natural disasters) that affect survival and reproduction:

Habitat destruction and Degradation
Extinction & Habitat Loss (9.9)
What are the two primary causes of species extinction?:
Lower overall population sizes and reduced growth rates
Extinction & Habitat Loss (9.9)
What des reductions in habitat size lead to?:
Carrying Capacity (K)
Logistic Population Growth (11.1)
The maximum population size that a specific environment can sustainably support over time due to resource limitations:

Logistic Model
Logistic Population Growth (11.1)
Models growth when resources are limited. Growth slows as the population size (N) approaches carrying capacity (K):

Birth rates decrease, mortality rates increase, population growth slows
Density-Dependent Regulation (11.2)
As population density increases, brith and mortality rates (?) causing population growth to (?):
Scramble Competition
Infraspecific Competition (11.3)
All individuals get an equal share of resources, which can lead to severe resource shortages for everyone if density is too high:
Contest Competition
Infraspecific Competition (11.3)
Dominant individuals secure full resources while subordinates get none, ensuring at least some individuals survive and reproduce:
Growth and Development
Effects of Competition (11.4 – 11.6)
Slowed or stunted growth at high densities:
Mortality
Effects of Competition (11.4 – 11.6)
Higher population density increases these rates, freeing up resources for remaining survivors:
Reproduction
Effects of Competition (11.4 – 11.6)
High density delays reproductive maturity and lowers fecundity (number of offspring):
Delayed reproduction, lower immunity, and abnormal behaviors
Density and Stress (11.7)
Crowing causes physiological stress in animals, leading to what?:
Dispersal
Dispersal & Social Behavior (11.8 & 11.9)
Subordinate or excess individuals leave crowded areas to seek open habitat:
Social Hierarchies
Dispersal & Social Behavior (11.8 & 11.9)
Dominant individuals secure priority access to food and mates, limiting reproduction to fewer individuals:
Territory
Territoriality (11.10 & 11.11)
A defended exclusive area containing essential resources:
Breeding Regulation
Territoriality (11.10 & 11.11)
Non-territorial individuals (“floaters”) are excluded from breeding, stabilizing overall population growth:
Plants
Territoriality (11.10 & 11.11)
Preempt space and resources (light, water, nutrients) by shading out or crowding neighbors:
Inverse Density Dependence (Alee Effect)
Inverse Density Dependence & Density-Independent Factors (11.12 & 11.13)
At extremely low densities, population growth rates decrease because individuals struggle to find mates/defend against predators:
Density-Independent Factors
Inverse Density Dependence & Density-Independent Factors (11.12 & 11.13)
Abiotic forces (weather, floods, fire, natural disasters) that affect survival regardless of population density:
Resource Quality
How effectively a specific resource meets an organism’s biological needs for survival, growth, and reproduction: