ecology 2600 Population ecology (5)
 Call Kai
 Learn
 Practice Test
 Spaced Repetition
 Match
 Flashcards
 Knowt Play
1/44

There's no tags or description
Looks like no tags are added yet.
45 Terms
Distribution & abundance
Physical environment & species interactions limit the geographic distribution of species
• Individuals within populations are distributed in patterns that may be random, regular, or clumped
• Metapopulations consist of interconnected subpopulations
• Organism size influences population density
population
A population is a group of individuals of the same species living in a specific area
BIDE model
Nt+1 = Nt + B + I – D – E
• Nt+1 : size of population at time t + 1 in the future
• Nt : size of population at time t
• B : births,
I : immigrants,
D : deaths,
E : emigrants
Cohort analysis:
• keep track of a cohort from birth to death.
• Record age of death, number of offspring each year.
• Usually done with short-lived organisms.
Static life tables:
• Population viewed as a snapshot in time.
• Record age of death of a large number of individuals
• Goal is to estimate survivorship
Distributional limits• Kangaroo distributions & climate in Australia

Distributional limits • Monarch butterfly distribution & climate

distributional limits
• Temperature, water, climate, topography and other elements of the physical environment limit the distribution of species
Species interactions
competition, predation, mutualism, etc limit the distribution of species
Distributional patterns
• Can be random, regular or clumped
• What do you think is most common among organisms?

Metapopulation
a population of populations linked by dispersal – Levins 1969
Metapopulation models
dp/dt = mp (1-p) - ep
• p: number of occupied patches
• m: colonization rate
• e: extinction rate
• Population persists (p > 0) if
•m > e
Colonization rate is larger than extinction rate
What may influence if a species colonizes or goes extinct from a patch?
lack of resources
• General species-area relationship
A = area
• S = Species
• E = Endemic Sp.
Organism size and distribution
• If environment is finite and larger organisms require more resources to persist
• We would expect population density of larger organisms to be lower than population density of smaller organisms
Population structure & growth
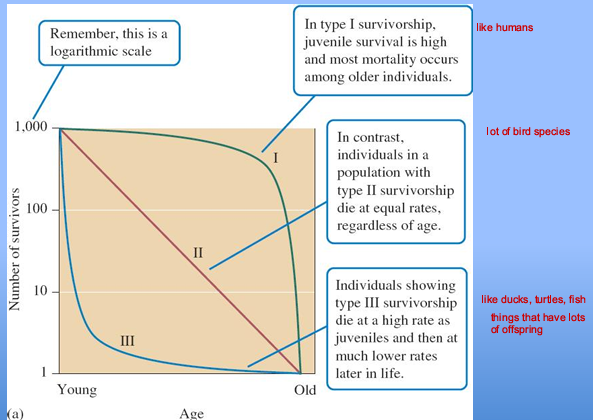
• Survivorship varies among different populations
• Geometric rate of increase in one way to measure if a population is growing or declining
• With abundant resources, populations can grow at geometric or exponential rates
• If resources are limited, population growth rate slows and eventually stops; this is known as logistic population growth
Survivorship curves
Density dependence
Birth, immigration, death and emigration rates can depend or not on population size
could be cause of competition
• Density dependence in grassland plant species

• Density dependence in zooplankton species
Data from 1995-1997, multiple samples per yr • Lake Blankaart, Belgium

Measuring change in population size
• Ecologists want to know if population size is increasing, decreasing, stable
• A declining population may require management intervention to avoid extinction
• E.g. limestone barrens
Geometric rate of increase (λ)
the ratio of the population size at two points in time
λ = Nt+1 /Nt
• Nt+1 – size of the population at some future time (t + 1) • Nt – size of the population at some earlier time (t)
Survivorship _ among different populations
varies
geometric growth rate
• Geometric rate of increase in one way to measure if a population is growing or declining
• With abundant resources, populations can grow at geometric or exponential rates
• If resources are limited, population growth rate slows and eventually stops; this is known as logistic population growth
Exponential population growth
population that produces a J-shaped pattern of population increase. •
It represents population growth as a continuous process
the differential equation to find a closed-form solution to this model

Comparing λ and r

Modelling population growth integrated equation

Logistic population growth
A pattern of growth that produces a sigmoidal, or S-shaped, population growth curve; population size levels off at carrying capacity (K)
• Population growth when resources are limited
• What kind of things can limit population growth → competition for resources

The concepts of — are central to the science of ecology
fundamental and realized niche
Life history trade offs
• Organisms have limited energy and resources for survival, offspring production and offspring size
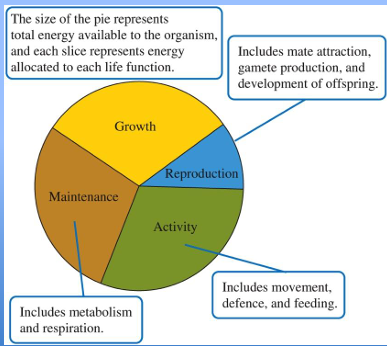
life trade-offs ground squirrel

Life history classification : r-selected
selection that favours those life-history traits that cause increases in growth rates
Life history classification : K-selected
: selection that favours those life-history traits important for when habitats are “full” of a population
-favour efficiency resource use
Life histories classification: Stress
environmental conditions that limit growth of plant
Life histories classification: Disturbance
process that removes plant biomass
Niche
n-dimensional hypervolume, where n equals the number of environmental factors important to the survival and reproduction of a species
Fundamental niche
the physical conditions under which a species might live, in the absence of interactions with other species

Realized niche
actual niche of a species whose distribution is restricted by biotic interactions such as competition, predation, disease, and parasitism

Fundamental & realized niche and bees

Fundamental & realized niche and lizards

Ontogeny
development of an organism
Ontogenetic niche shifts
use of different resources/habitat during development

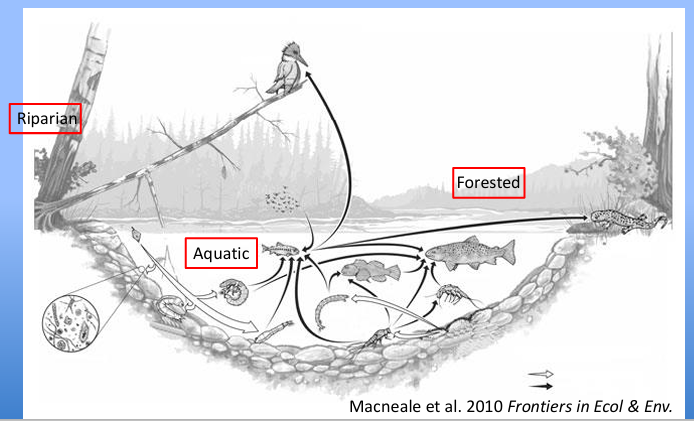
Niche shifts can — distinct ecosystems!
couple