ch 7 Microeconomics
 Call Kai
 Learn
Learn Practice Test
 Spaced Repetition
 Match
Match Flashcards
 Knowt Play
1/47

There's no tags or description
Looks like no tags are added yet.
Name | Mastery | Learn | Test | Matching | Spaced | Call with Kai | Chat |
|---|
No analytics yet
Send a link to your students to track their progress
48 Terms
Welfare economics, public assistance, willingness to pay, consumer surplus, willingness to sell, producer surplus, Willingness to pay, value, pay, higher, less, consumer surplus, WTP, price paid, individual surpluses, market consumer surplus, demand curve, price paid, quantities, decreases, marginal benefit, X, consumers, WTP
Ch 7 - Teacher Notes
_____ _____ is about economic well-being. Welfare economics is NOT about _____ _______ such as food stamps.
Abbreviations:
WTP = _______ ___ ____
CS = (market) _______ _______
WTS = _______ ___ ____
PS = (market) _______ _______
Consumer Surplus
______ ___ _______: maximum amount a buyer will pay for a good.
This WTP represents the ____ a consumer puts on that good.
WTP does not mean that the consumer will actually ____ his/her WTP.
If the actual market price of the good is _____ than the consumer’s WTP, then the consumer does not buy the good and does not get any consumer surplus.
If that consumer actually pays ___ than its WTP, then the consumer gets a _____ _____.
Consumer surplus for one consumer = ______ – ____ ______
Example
Your WTP for a pair of shoes is $70 but you actually pay $50, so your consumer surplus is $20 ($70 - $50)
(WTP) 70 - 50 (Paid) = 20 (consumer surplus)
If we look at the consumers in a market, we take into account all the ______ _____. The _____ ____ _____ (CS) is the sum of all the individual [WTP – price paid]. Read the example in the book about the four Elvis fans.
Graphically, the CS is represented by the area below the _____ _____ and above the ____ _____ (P*). In this chapter 7, the price paid by consumers will be P*.
We use the demand curve because the demand curve represents consumers’ WTP for different _______. As we go down the market demand curve, the WTP ______ (My note: decreases because while the number of people (Q) increases they are people who are less willing to pay high prices).
Think of your demand for soft drinks during a hot summer day. Because you are extremely thirsty, for the first can of soda you would be willing to pay $1.50, for the second can of soda you would be willing to pay $1.40, for the third can of soda you would be willing to pay $1.30 and so on….but you only actually $0.90 for each can of soda if the market price is $0.90.
Your willingness to pay decreases as you consume more sodas because you become less and less thirsty. This WTP represents the ____ ____ (MB) you get for each extra-can of soda. The WTP is the distance from the __-axis to the demand curve. If you are the only buyer in that market:(GRAPH)
-1.50 —> high WTP (Q1) because you are very thirsty
-1.40 —→ WTP decreases (Q2) because you are less thirsty
-1.30 —→ WTP decreases more (Q3) because you are even less thirsty
The market demand curve with many buyers is based on the same principle: the market demand curve represents the marginal benefit to ____ and their ____.
![<p>Ch 7 - Teacher Notes</p><p>_____ _____ is about economic well-being. Welfare economics is NOT about _____ _______ such as food stamps.</p><p class="p2"></p><p class="p1">Abbreviations: </p><p class="p1">WTP = _______ ___ ____</p><p class="p1">CS = (market) _______ _______</p><p class="p1">WTS = _______ ___ ____</p><p class="p1">PS = (market) _______ _______ </p><p class="p1"></p><p class="p3"><strong>Consumer Surplus</strong></p><p class="p1">______ ___ _______: maximum amount a buyer will pay for a good. </p><p class="p1">This WTP represents the ____ a consumer puts on that good. </p><p class="p1">WTP does not mean that the consumer will actually ____ his/her WTP. </p><p class="p2"></p><ul><li><p>If the actual market price of the good is _____ than the consumer’s WTP, then the consumer does not buy the good and does not get any consumer surplus. </p></li><li><p>If that consumer actually pays ___ than its WTP, then the consumer gets a _____ _____. </p></li></ul><p class="p2"></p><p class="p1"><strong><u>Consumer surplus for one consumer</u></strong> = ______ – ____ ______</p><p class="p2"></p><p class="p1"><strong>Example</strong></p><p class="p1">Your WTP for a pair of shoes is $70 but you actually pay $50, so your consumer surplus is $20 ($70 - $50)</p><p class="p2">(WTP) 70 - 50 (Paid) = 20 (consumer surplus)</p><p class="p1"><strong><br></strong>If we look at the consumers in a market, we take into account all the ______ _____. The _____ ____ _____ (CS) is the sum of all the individual [WTP – price paid]. Read the example in the book about the four Elvis fans.<strong> </strong></p><p class="p2"></p><p class="p1">Graphically, the CS is represented by the area below the _____ _____ and above the ____ _____ (P*). In this chapter 7, the price paid by consumers will be P*. <br></p><p class="p1">We use the demand curve because the demand curve represents consumers’ WTP for different _______. As we go down the market demand curve, the WTP ______ (My note: decreases because while the number of people (Q) increases they are people who are less willing to pay high prices). </p><p class="p2"></p><p class="p1">Think of your demand for soft drinks during a hot summer day. Because you are extremely thirsty, for the first can of soda you would be willing to pay $1.50, for the second can of soda you would be willing to pay $1.40, for the third can of soda you would be willing to pay $1.30 and so on….but you only actually $0.90 for each can of soda if the market price is $0.90. </p><p class="p1">Your willingness to pay decreases as you consume more sodas because you become less and less thirsty. This WTP represents the ____ ____ (MB) you get for each extra-can of soda. The WTP is the distance from the __-axis to the demand curve. If you are the only buyer in that market:(GRAPH)</p><p class="p1">-1.50 —> high WTP (Q1) because you are very thirsty</p><p class="p1">-1.40 —→ WTP decreases (Q2) because you are less thirsty </p><p class="p1">-1.30 —→ WTP decreases more (Q3) because you are even less thirsty </p><p class="p1">The market demand curve with many buyers is based on the same principle: the market demand curve represents the marginal benefit to ____ and their ____. </p>](https://assets.knowt.com/user-attachments/96c10cb6-e7ec-4102-9fc6-0ae9e799857e.png)
Consumer surplus
_____ ______ for one consumer = WTP – price paid
Willingness to pay
Consumer Surplus
______ ___ _______: maximum amount a buyer will pay for a good.
This WTP represents the value a consumer puts on that good.
WTP does not mean that the consumer will actually pay his/her WTP.
If the actual market price of the good is higher than the consumer’s WTP, then the consumer does not buy the good and does not get any consumer surplus.
If that consumer actually pays less than its WTP, then the consumer gets a consumer surplus.
Willingness to sell
_____ __ ______: minimum amount a seller would accept to sell the good.
This WTS represents the cost to the seller.
The seller may actually receive a market price higher than its WTS.
If the market price is less than the seller’s WTS, then the seller is not willing to sell the good.
If the actual price received is higher than the seller’s WTS, then the seller sells the good and gets a producer surplus.
Producer surplus
______ ______ for one seller = price received – WTS
Willingness to sell, cost, market, higher, less, not, higher, producer surplus, price received, WTS, individual, market producer surplus, below, supply surve
Ch 7 - Teacher Notes
Producer Surplus
______ to _____: minimum amount a seller would accept to sell the good.
This WTS represents the cost to the seller.
The seller may actually receive a _____ price _____ than its WTS.
If the market price is __ than the seller’s WTS, then the seller is ____ willing to sell the good.
If the actual price received is ____ than the seller’s WTS, then the seller sells the good and gets a ____ ____.
Producer surplus for one seller = ____ ____ – ____
Example
Your WTS a pair of shoes is $45 but you actually get $60, so your producer surplus is $15 ($60 - $45)
Market Producer Surplus
If we look at the producers in a market, we take into account all the _____ surpluses. The ____ ____ ____ (PS) is the sum of all the individual [price received – WTS]. Read the example in the book about the 4 painters.
Graphically, the PS is represented by the area ___ the price received and above the ____ ____. In this chapter 7, the price received by sellers will be P*.
CS, PS, price paid, price received
Ch 7 - Teacher Notes
Market Consumer Surplus and Market Producer Surplus
You have to remember the following:
____ = area below the demand curve and above the price paid
____ = area below the price received and above the supply curve
If you do not use the above definitions the next chapters are going to be very hard to understand. The best way graphically is to use a blank index card and hide the areas you do not need.
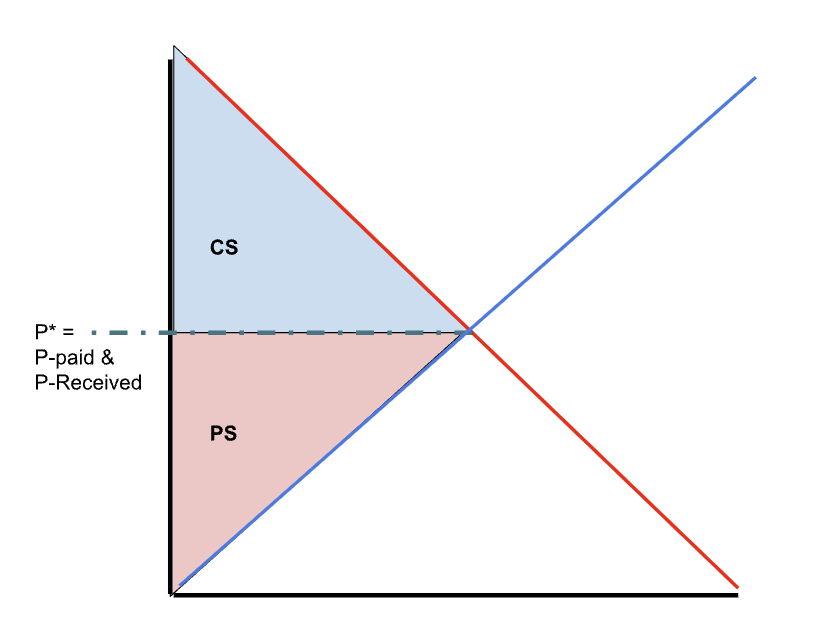
In this chapter, the ___ ____ and the ____ ____ is P*, but this will not be the case in the next chapters so I recommend that you use ‘price paid’ and ‘price received’ rather than P*. In the graph above, area A represents the CS and area B represents the PS.
Graphically (look at graph)
Areas are determined by solid lines.
Area A = consumer surplus
Area B = producer surplus

decreases, increases, decreases, increases, decreases, increases
Ch 7 - Teacher Notes
Changes in P* (caused by shifters), CS, and PS.
You need to review the shifters introduced in chapter 4. You will need those for the homework and the quiz.
Changes in CS caused by shifts of the supply curve.
You will not be asked to look at changes in CS if the demand curve shifts because to measure those changes you would actually need to calculate areas.
If the supply ______ (shifts left) => P* ______ => CS ______.
If the supply ______ (shifts right) => P* ______ => CS ______.
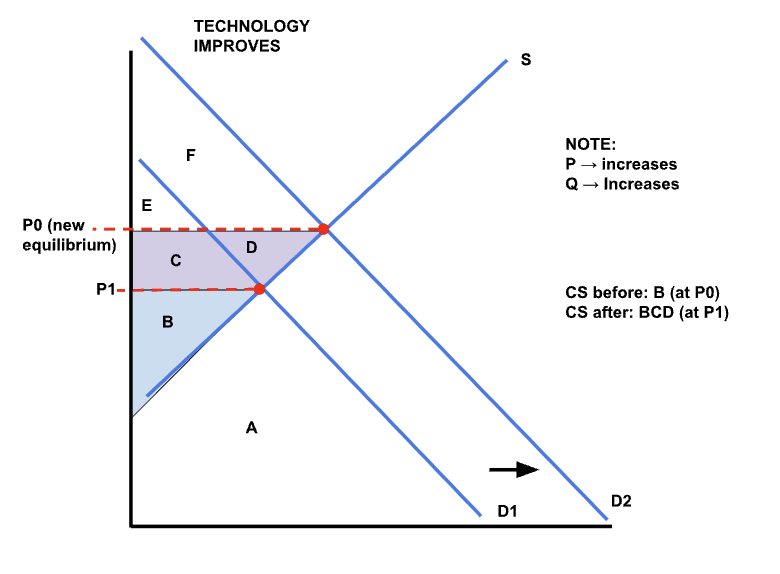
Example (look at Graph): if technology improves => the supply curve shifts right => P* decreases => CS increases
When the price paid is P1, CS = area A.
When the price decreases to P2 , CS = areas A, B, and C.


decreases, decreases, decreases, increases, increases, increases, well-being, consumers, buyers
Ch 7 - Teacher Notes
Changes in PS caused by shifts of the demand curve.
You will not be asked to look at changes in PS if the supply curve shifts because to measure those changes you would actually need to calculate areas.
If the demand _____ (shifts left) => P* _____ => PS _____.
If the demand _____ (shifts right) => P* _____ => PS _____.
When the price received is P1, PS = areas A, B, and C.
When the price decreases to P2 , PS = area C.
Total Surplus
Total surplus measures the___-_____ of society. In this chapter ‘society’ is made up of ____ and ____ only.
So in this chapter, total surplus = CS + PS.
Total surplus is the area between the 2 curves (in this chapter).
Make sure you read about total surplus, market efficiency and why at the market equilibrium, total surplus is maximized.
Welfare economics, allocation, well-being,
Ch 7 - Teacher Handout
Chapter 7: Consumers, Producers, and the Efficiency of Markets.
This chapter deals with welfare economics.
_____ ______: study of how the ____ of resources affects economic well-being.
Welfare economics is NOT about public assistance such as food stamps.
Abbreviations:
WTP = willingness to pay
CS = (market) consumer surplus
WTS = willingness to sell
PS = (market) producer surplus
TS = (market) total surplus
maximum, buyer, value, not, consumer surplus, WTP, price paid, sum, below, above, demand, marginal benefit, WTP, adding, negative
Ch 7 - Teacher Handout
Consumer Surplus
Willingness to pay: _____ amount a ____ will pay for a good.
This WTP represents the ____ a consumer puts on that good.
WTP does ___ mean that the consumer will actually pay its WTP.
If the actual market price of the good is higher than the consumer's WTP, then the consumer does not buy the good and does not get any consumer surplus.
If that consumer actually pays less than its WTP, then the consumer gets a ____ ____.
Consumer surplus for one consumer = ____ – ____ ____
Example: your WTP for a pair of shoes is $70 but you actually pay $50, so your consumer surplus is $20 ($70 - $50).
[(WTP) 70 - 50 (paid) = 20 (customer surplus)]
If we look at the consumers in a market, we take into account all the individual surpluses. The market consumer surplus (CS) is the ____ of all individuals [WTP – price paid].
Graphically, the CS is represented by the area ___ the demand curve and ____ the price paid. In this chapter 7, the price paid by consumers will be P*.
We use the ____ curve because the demand curve represents consumers' WTP for different quantities. As we go down the market demand curve, the WTP decreases.
Think of your demand for soft drinks during a hot summer day. Because you are extremely thirsty, for the first can of soda you would be willing to pay $1.50, for the second can of soda you would be willing to pay $1.40, for the third can of soda you would be willing to pay $1.30 and so on.... but you only actually pay $0.90 for each can of soda if the market price is $0.90. Your willingness to pay decreases as you consume more sodas because you become less and less thirsty. This WTP represents the ______ _____ (MB) you get for each extra can of soda.
The ___ is the distance from the x-axis to the demand curve. If you are the only buyer in that market: (GRAPH 1)
The market demand curve with many buyers is based on the same principle: the market demand curve represents the marginal benefit to consumers and their WTP. (graph 2)
For Q = 1: the WTP is WTP1 and is represented by the heavy line + the dashed line.
The CS is WTP1 - P* and is represented by the heavy line.
If WTP1 = $5 and P* = $2 then CS for Q = 1 is $3.
For Q = 2: the WTP is WTP2 and is represented by the heavy line + the dashed line.
The CS is WTP2 - P* and is represented by the heavy line.
If WTP2 = $4.50 and P* = $2 then CS for Q = 2 is $2.50.
For Q = 3: the WTP is WTP3 and is represented by the heavy line + the dashed line.
The CS is WTP3 - P* and is represented by the heavy line.
If WTP3 = $4 and P* = $2 then CS for Q = 3 is $2.
For Q = 4: the WTP is WTP4. The CS is WTP4 - P* = $0 since WTP4 = P*.
We can calculate the CS for all quantities (between Q = 0 and Q = 4) and ____ them up, we get the market CS. That market CS is represented by the area below the demand curve and above the price paid, here P*, up to Q*, here 4.
If we pass Q = 4, the WTP is below P* which implies that CS becomes ______.
[Price paid (P*) is still $2 so beyond that at the Q5 the price customer is willing to pay may be $.50 but they price they MUST pay is $2. Thus $2 - $.50 = -1.50]
![<p>Ch 7 - Teacher Handout</p><p><span style="background-color: transparent;"><strong><u>Consumer Surplus</u></strong></span></p><p><span style="background-color: transparent;"><strong><u>Willingness to pay</u></strong><u>: </u>_____ amount a ____ will pay for a good.</span></p><p><span style="background-color: transparent;">This WTP represents the ____ a consumer puts on that good.</span></p><p><span style="background-color: transparent;">WTP does ___ mean that the consumer will actually pay its WTP.</span></p><ul><li><p><span style="background-color: transparent;">If the actual market price of the good is higher than the consumer's WTP, then the consumer does not buy the good and does not get any consumer surplus.</span></p></li><li><p><span style="background-color: transparent;">If that consumer actually pays less than its WTP, then the consumer gets a ____ ____.</span></p></li></ul><p><span style="background-color: transparent;"><strong><u>Consumer surplus</u></strong> for one consumer = ____ – ____ ____</span></p><p><br></p><p><span style="background-color: transparent;">Example: your WTP for a pair of shoes is $70 but you actually pay $50, so your consumer surplus is $20 ($70 - $50).</span></p><p>[(WTP) 70 - 50 (paid) = 20 (customer surplus)] <br></p><p><span style="background-color: transparent;">If we look at the consumers in a market, we take into account all the individual surpluses. The market consumer surplus (CS) is the ____ of all individuals [WTP – price paid].</span></p><p><br></p><p><span style="background-color: transparent;"><strong>Graphically, the CS is represented by the area ___ the demand curve and </strong>____<strong> the price paid.</strong> In this chapter 7, the price paid by consumers will be P*.</span><br></p><p><span style="background-color: transparent;">We use the ____ curve because the demand curve represents consumers' WTP for different quantities. As we go down the market demand curve, the WTP decreases.</span><br></p><p><span style="background-color: transparent;">Think of your demand for soft drinks during a hot summer day. Because you are extremely thirsty, for the first can of soda you would be willing to pay $1.50, for the second can of soda you would be willing to pay $1.40, for the third can of soda you would be willing to pay $1.30 and so on.... but you only actually pay $0.90 for each can of soda if the market price is $0.90. Your willingness to pay decreases as you consume more sodas because you become less and less thirsty. This WTP represents the ______ _____ (MB) you get for each extra can of soda.</span></p><p></p><p><span style="background-color: transparent;">The ___ is the distance from the x-axis to the demand curve. If you are the only buyer in that market: (GRAPH 1)</span></p><p><span style="background-color: transparent;">The market demand curve with many buyers is based on the same principle: the market demand curve represents the marginal benefit to consumers and their WTP. (graph 2)</span><br></p><p><span style="background-color: transparent;">For Q = 1: the WTP is WTP1 and is represented by the heavy line + the dashed line.</span></p><p><span style="background-color: transparent;">The CS is WTP1 - P* and is represented by the heavy line.</span></p><p><span style="background-color: transparent;">If WTP1 = $5 and P* = $2 then CS for Q = 1 is $3.</span></p><p><br></p><p><span style="background-color: transparent;">For Q = 2: the WTP is WTP2 and is represented by the heavy line + the dashed line.</span></p><p><span style="background-color: transparent;">The CS is WTP2 - P* and is represented by the heavy line.</span></p><p><span style="background-color: transparent;">If WTP2 = $4.50 and P* = $2 then CS for Q = 2 is $2.50.</span></p><p><br></p><p><span style="background-color: transparent;">For Q = 3: the WTP is WTP3 and is represented by the heavy line + the dashed line.</span></p><p><span style="background-color: transparent;">The CS is WTP3 - P* and is represented by the heavy line.</span></p><p><span style="background-color: transparent;">If WTP3 = $4 and P* = $2 then CS for Q = 3 is $2.</span></p><p><br></p><p><span style="background-color: transparent;">For Q = 4: the WTP is WTP4. The CS is WTP4 - P* = $0 since WTP4 = P*.</span></p><p><br></p><p><span style="background-color: transparent;">We can calculate the CS for all quantities (between Q = 0 and Q = 4) and ____ them up, we get the market CS. That market CS is represented by the area below the demand curve and above the price paid, here P*, up to Q*, here 4.</span><br></p><p><span style="background-color: transparent;">If we pass Q = 4, the WTP is below P* which implies that CS becomes ______.</span></p><p>[Price paid (P*) is still $2 so beyond that at the Q5 the price customer is willing to pay may be $.50 but they price they MUST pay is $2. Thus $2 - $.50 = -1.50]</p>](https://assets.knowt.com/user-attachments/7bacca51-9849-4217-90aa-12aaaddd70f2.png)
minimum, seller, sell, opportunity cost, market, higher, not, producer surplus, price received, WTS, marginal cost, below, above, adding, negative
Ch 7 - Teacher Handout
Producer Surplus
Willingness to sell: ____ amount a ____ would accept to ____ the good.
This WTS represents the (______) ____ of the seller.
The seller may actually receive a _____ price ____ than its WTS.
If the market price is less than the seller's WTS, then the seller is ____ willing to sell the good.
If the actual price received is higher than the seller's WTS, then the seller sells the good and gets a _____ ____.
Producer surplus for one seller = ____ ____ – ____
Example: your WTS a pair of shoes is $45 but you actually get $60, so your producer surplus is $15 ($60 - $45).
If we look at the producers in a market, we take into account all the individual surpluses. The market producer surplus (PS) is the sum of individual [price received - WTS].
The market supply curve represents the ___ ____ of sellers (cost of producing an extra unit) and their WTS.
Graphically, the PS is represented by the area ____ the price received and ____ the supply curve. In this chapter 7, the price received by sellers will be P*. (GRAPH 1)
For Q = 1: the WTS is WTS1 and is represented by the dashed line.
The PS is P* - WTS1 and is represented by the heavy line.
If WTS1 = $1 and P* = $4 then PS for Q = 1 is $3.
For Q = 3: the WTS is WTS3 and is represented by the dashed line.
The PS is P* - WTS3 and is represented by the heavy line.
If WTS3 = $2 and P* = $4 then PS for Q = 3 is $2.
For Q = 7: the WTS is WTS7 and is represented by the dashed line. Since WTS7 = P*, the PS is $0.
We can calculate the PS for all quantities (between Q = 0 and Q = 7) and ____ them up, we get the market PS. That market PS is represented by the area below the price received, here P*, and above the supply curve, up to Q*, here 7.
If we pass Q = 7, the WTS is above P* which implies that PS becomes ____.
![<p>Ch 7 - Teacher Handout</p><p><span style="background-color: transparent;"><strong><u>Producer Surplus</u></strong></span></p><p><span style="background-color: transparent;"><strong><u>Willingness to sell: </u></strong>____ amount a ____ would accept to ____ the good.</span></p><p><span style="background-color: transparent;">This WTS represents the (______) ____ of the seller.</span></p><p><span style="background-color: transparent;">The seller may actually receive a _____ price ____ than its WTS.</span></p><ul><li><p><span style="background-color: transparent;">If the market price is less than the seller's WTS, then the seller is ____ willing to sell the good.</span></p></li><li><p><span style="background-color: transparent;">If the actual price received is higher than the seller's WTS, then the seller sells the good and gets a _____ ____.</span></p></li></ul><p><span style="background-color: transparent;"><u>Producer surplus</u> for one seller = ____ ____ – ____</span></p><p><br><span style="background-color: transparent;">Example: your WTS a pair of shoes is $45 but you actually get $60, so your producer surplus is $15 ($60 - $45).</span></p><p><span style="background-color: transparent;">If we look at the producers in a market, we take into account all the individual surpluses. The market producer surplus (PS) is the sum of individual [price received - WTS].</span></p><p></p><p><span style="background-color: transparent;">The market supply curve represents the ___ ____ of sellers (cost of producing an extra unit) and their WTS.</span></p><p><br></p><p><span style="background-color: transparent;">Graphically, the PS is represented by the area ____ the price received and ____ the supply curve. In this chapter 7, the price received by sellers will be P*. (GRAPH 1)</span></p><p><br></p><p><span style="background-color: transparent;">For Q = 1: the WTS is WTS1 and is represented by the dashed line.</span></p><p><span style="background-color: transparent;">The PS is P* - WTS1 and is represented by the heavy line.</span></p><p><span style="background-color: transparent;">If WTS1 = $1 and P* = $4 then PS for Q = 1 is $3.</span></p><p><br></p><p><span style="background-color: transparent;">For Q = 3: the WTS is WTS3 and is represented by the dashed line.</span></p><p><span style="background-color: transparent;">The PS is P* - WTS3 and is represented by the heavy line.</span></p><p><span style="background-color: transparent;">If WTS3 = $2 and P* = $4 then PS for Q = 3 is $2.</span></p><p><br></p><p><span style="background-color: transparent;">For Q = 7: the WTS is WTS7 and is represented by the dashed line. Since WTS7 = P*, the PS is $0.</span></p><p><br></p><p><span style="background-color: transparent;">We can calculate the PS for all quantities (between Q = 0 and Q = 7) and ____ them up, we get the market PS. That market PS is represented by the area below the price received, here P*, and above the supply curve, up to Q*, here 7.</span></p><p><br></p><p><span style="background-color: transparent;">If we pass Q = 7, the WTS is above P* which implies that PS becomes ____.</span></p>](https://assets.knowt.com/user-attachments/ad134add-9aff-4b72-8731-5d0006d54b18.png)

Areas, CS, PS, price paid, price received
Ch 7 - Teacher Handout
Together CS and PS Graphically: (graph 2)
____ are determined by solid lines.
You have to remember the following:
____ = area below the demand curve and above the price paid.
____ = area below the price received and above the supply curve.
In the graph above, area A represents the CS and area B represents the PS.
In this chapter, the ____ ____ and the ____ ____ is P*, but this will not be the case in the next chapters.
shifts, decreases, increases, decreases, increases, decreases, increases
Ch 7 - Teacher Handout
Changes in P* (caused by shifters), CS, and PS.
You need to review the shifters introduced in chapter 4.
Changes in CS caused by ____ of the supply curve.
You will not be asked to look at changes in CS if the demand curve shifts because to measure those changes you would actually need to calculate areas.
If the supply ____ (shifts left) => P* ____ => CS ____.
If the supply ____ (shifts right) => P* ____ => CS ____.
Example: if technology improves => the supply curve shifts right => P* decreases => CS increases (GRAPH)
When the price paid is P1, CS = area A.
When the price decreases to P2, CS = areas A, B and C.

shifts, decreases, decreases, decreases, increases, increases, increases
Ch 7 - Teacher Handout
Changes in PS caused by ___ of the demand curve.
You will not be asked to look at changes in PS if the supply curve shifts because to measure those changes you would actually need to calculate areas.
If the demand ______ (shifts left) => P* ______ => PS ______.
If the demand ______ (shifts right) => P* ______ => PS ______.
(GRAPH)
When the price received is P1, PS = areas A, B, and C.
When the price decreases to P2, PS = area C.
In the MindTap homework, you will need to calculate areas of triangles....1/2 (base x height)

WTP, WTS
Total surplus = value to buyers as measured by ____ – cost of sellers as measured by ____.
Efficiency
_____: allocation of resources maximizes TS and maximizes total well-being.
Total surplus, consumers, producers, WTP, minus, WTS, value, demand, cost, supply, pay, above, not, less than, equal, lowest, greater, increase, increase, equal, maximized, smaller, decrease, decrease, decrease, increases, decreases, efficient, price, self-interest, Invisible hand
Ch 7 - Teacher Handout
Total Surplus (TS)
_____ _____ measures the well-being of society. In this chapter 'society' is made up of _____ and _____ only.
TS = (value to buyers as measured by WTP - price paid by buyers) + (price received by sellers - cost of sellers as measured by WTS).
The price paid and the price received is here P* so those 2 terms cancel out and you are left with
TS = value to buyers as measured by ____ ____ cost of sellers as measured by _____.
Recall that the _____ to buyers is represented by the _____ curve and the _____ of sellers is represented by the _____ curve.
Graphically, in this chapter, total surplus is the area between the demand and supply curves to the left of Q*. In this example, TS = A + B or the sum of CS + PS.
(GRAPH 1)
_____: allocation of resources maximizes TS and maximizes total well-being.
In a free market (with no government) is P* / Q* an efficient outcome? Does it maximize TS?
At P*:
The consumers willing to _____: allocation of resources maximizes TS and maximizes total well-being.____ P* (or ____) get the good. Those are the buyers who value the good the most. The consumers not willing to pay P* do ___ get the good.
The sellers whose opportunity costs are ____ ____ or ____ to P* (price received) are willing to supply the good. Those are the sellers able to produce the good at ___ cost.
(GRAPH 2)
For any quantity on the left of Q*, the value to buyers (represented by the bigger arrow) is _____ than the cost to sellers (smaller arrow).
As long as the value to buyers is greater than the cost to sellers: Q should _____ to _____ TS.
At Q*, the value to buyers is _____ to the cost of sellers. TS is _____.
For any point on the right of Q*, the value to buyers (smaller dashed arrow) is ___ than the cost to sellers (bigger dashed arrow). The quantity should _____.
As long as the value to buyers is less than the cost to sellers: Q should _____. Producing on the right of Q* actually _____ TS.
Another way of looking at efficiency is to think of the demand curve as being the MB to buyers and the supply curve of being the MC to sellers.
As long as MB > MC, _____ Q.
If MB < MC, _____ Q.
Stop when MB = MC (_____).
The equilibrium (P*, Q*) is efficient.
No government (or central planner) directs the market participants. The socially efficient outcome (P*, Q*) is reached through the ____ mechanism and ____-____: the ____ ____.

consumer surplus
_____ ______: the amount a buyer is willing to pay for a good minus the amount the buyer actually pays for it
efficiency
______: the property regarding a resource allocation of maximizing the total surplus received by all members of society
welfare economics
______ ________: the study of how the allocation of resources affects economic well-being
willingness to pay
______ __ ______: the maximum amount that a buyer will pay for a good
equality
______: the property of distributing economic prosperity uniformly among the members of society
producer surplus
_____ ______: the amount a seller is paid for a good minus the seller's cost of providing it
cost
____: the value of everything a seller must give up to produce a good
false
Ch 7 - Cengage
Consumer surplus is the amount a buyer actually has to pay for a good minus the amount the buyer is willing to pay for it.
a. True
b. False
Why? Consumer surplus is defined as the amount a buyer is willing to pay for a good minus the amount the buyer actually pays for it.
false
Ch 7 - Cengage
Total surplus in a market can be measured as the area below the supply curve plus the area above the demand curve, up to the point of equilibrium.
a. True
b. False
Why? Total surplus is the sum of consumer surplus and producer surplus. Graphically, it is measured as the area below the demand curve and above the supply curve, up to the point of equilibrium.
The area below the supply curve and above the demand curve does not represent total economic welfare or surplus.

false
Ch 7 - Cengage
Total surplus in a market is consumer surplus minus producer surplus.
a. True
b. False
Why? Total surplus in a market is the sum of consumer surplus and producer surplus, not the difference
TS = CS + PS
Consumer surplus: Buyer's willingness to pay minus the price paid.
Producer surplus: Price received minus the cost of production.
Total surplus: Combines both benefits to measure overall economic welfare.
true
Ch 7 - Cengage
The area below the price and above the supply curve measures the producer surplus in a market.
a. True
b. False
Why? Producer surplus is the difference between what sellers are willing to accept for a good and what they actually receive at the market price. [1]
Graphically, this value is shown as the region located below the market price line and above the supply curve.
WHy? Explanation: This is the exact geometric definition of producer surplus. On a market graph, it is represented by the triangular area located below the market price and above the supply curve up to the quantity sold.
![<p>Ch 7 - Cengage</p><p>The area below the price and above the supply curve measures the producer surplus in a market.</p><p>a. True</p><p>b. False</p><p></p><p>Why? <span><strong>Producer surplus</strong> is the difference between what sellers are willing to accept for a good and what they actually receive at the market price.</span> [1]</p><ul><li><p><span><strong>Graphically</strong>, this value is shown as the region located below the market price line and above the supply curve.</span></p></li></ul><p>WHy? <span><strong>Explanation:</strong> This is the exact geometric definition of <strong>producer surplus</strong>. On a market graph, it is represented by the triangular area located <strong>below the market price and above the supply curve</strong> up to the quantity sold.</span></p>](https://assets.knowt.com/user-attachments/118c1476-3b20-48ae-aafc-715f4986aaf6.png)
true
Ch 7 - Cengage
Suppose there is an increase in supply that reduces market price. Consumer surplus increases because (1) consumer surplus received by existing buyers increases and (2) new buyers enter the market.
a. True
b. False
Why? When supply increases, the supply curve shifts to the right, causing the equilibrium price to fall and the equilibrium quantity to rise. This lower price expands consumer surplus through two distinct components:
Existing Buyers: Buyers who were already willing to purchase the good at the old, higher price now experience an increase in surplus because they get to pay a lower price for the exact same item.
New Buyers: The lower price brings in new consumers who were not willing to buy the good at the previous higher price, adding entirely new surplus to the market pool.

true
Ch 7 - Cengage
For any given quantity, the price on a demand curve represents the marginal buyer's willingness to pay.
a. True
b. False
Why? By definition, the height of the demand curve at any specific quantity shows the maximum amount that the marginal buyer—the consumer who would leave the market first if the price were any higher—is willing to pay for that unit of the good.
>the point for each quantity (aka the number of people willing to buy) touching the demand curve is the marginal buyer's WTP

false
Ch 7 - Cengage
All else equal, a decrease in demand will cause an increase in producer surplus.
a. True
b. False
Why? When demand decreases, the demand curve shifts to the left. This shift causes both the equilibrium price and the equilibrium quantity to fall.
Because producers are now selling fewer items and receiving a lower price for each item they sell, producer surplus decreases rather than increases.
Why? Shift in Demand: A decrease in demand shifts the entire demand curve to the left.
Market Impact: This shift causes both the equilibrium price and the equilibrium quantity to decrease.
Producer Surplus: Because sellers are now selling fewer units and receiving a lower price for each unit, producer surplus decreases.

true
Ch 7 - Cengage
Producer surplus is the amount a seller is paid minus the cost of production.
a. True
b. False
Why? This is the exact definition of producer surplus. It measures the benefit sellers receive from participating in a market. It is calculated by taking the actual price received by the seller and subtracting the seller's cost of producing that good.
Why? Producer surplus is defined as the difference between the actual amount a seller receives for a good or service and the minimum amount they would be willing to accept to produce it (which represents their total cost of production).
If you are studying microeconomics, I can also help you:
Calculate producer surplus using a supply schedule or graph.
Understand the difference between producer surplus and consumer surplus.
Learn how taxes or price controls affect total surplus.
true
Ch 7 - Cengage
Consumer surplus can be measured as the area between the demand curve and the equilibrium price.
a. True
b. False
Why? Graphically, consumer surplus is represented by the area that lies below the demand curve and above the equilibrium price, up to the equilibrium quantity purchased. This represents the total extra value consumers gain from paying a market price lower than their maximum willingness to pay.
Why? Definition: Consumer surplus is the difference between what a consumer is willing to pay for a good and what they actually pay.
Graphical Representation: On a standard supply and demand graph, it is shown as the triangular area below the demand curve and above the equilibrium price line, up to the equilibrium quantity.

false
Ch 7 - HW cengage
Suppose Alex is willing to pay a total of $210,000 for a luxury car.
True or False: Keeping his maximum willingness to pay for a luxury car in mind, Alex will buy the luxury car because it would be worth more to him than its market price of $280,000.
True
False
Cengage explanations: Consumer surplus is the difference between a buyer's willingness to pay (what the item is worth to the buyer) and what the buyer actually pays. Consumers will not purchase a good if its market price is above their willingness to pay, because purchasing it would make them worse off than not buying it. Thus, Alex will not purchase the luxury car, because the market price ($280,000) is greater than his willingness to pay ($210,000).
In economics, a consumer's Willingness to Pay (WTP) represents the maximum dollar amount they value that item at.
Since Alex only values the car at $210,000, buying it at the market price of $280,000 would mean he is paying $70,000 more than what the car is worth to him. This would result in a negative consumer surplus, so he chooses not to buy it.
CS
____: the area below the Demand Curve and above P-paid , up to the Q bought
CS = WTP - P-paid
WTP = MB (because if you have to pay more than the WTP the MB is less than the MC and you are no longer rational)

PS
___: Area below the P-Recived & above the supply curve, up to Q produced.
PS = WTS - P-received
the WTS is the opportunity cost (price to produce 1 unit of something)

CS, PS, CS - PS, greater than, equal
ch 7 -Notes
NO government
____: the area below the Demand Curve and above P-paid , up to the Q bought
TS = ___ __ ____
(Marginal Benefit) MB ___ ___ or ___ MC (marginal cost)
highest, ceiling, marginal cost
Extra Notes (not from class)
"WTP = MB because that is the ____ they go"
Correct. WTP is your Marginal Benefit, and it acts as a ceiling. You will never pay a price higher than this ceiling because you do not value it that high.
"Once past WTP, the ____ ____ is greater than MB"
Correct. If we talk about the market overall, the optimal stopping point for society is where MB = MC.
willing to pay, maximum. difference, Marginal Benefit, extra unit, Producers Surplus, marginal cost, producing 1 extra
ch 7 -Notes
CS you need to buy something and you are ____ __ ____ a ____ price
WTP → $50 but able to get it for $25 → CS is $35
CS is the _____ between the Willingness to Pay and the price you actually paid
WTP is tied up in ______ ______
WTP = MB (why are you willing to pay something/certain prices? It's because you think it's going to be of some benefit. The benefit you get from ____ ____ of something is the marginal benefit)
[1. THE CONSUMER SIDE (WTP >= Price)
* You must value the item MORE THAN OR EQUAL TO the price tag, or you will not buy it.
* Example: You buy a sandwich if your WTP is $10 and the Price is $7. You walk away if the price is $12.
* Consumer Surplus = WTP - Price
2. THE PRODUCER SIDE (Price >= MC)
* The store must sell the item for MORE THAN OR EQUAL TO what it cost them to make it (Marginal Cost / WTS), or they lose money.
* Example: The store sells the sandwich for $7 if their MC is $4. They will not sell it for $3.
* Producer Surplus = Price - MC
3. THE COMPLETE PICTURE
For a mutually beneficial trade to happen, the price sits in the middle:
$10 (WTP) >= $7 (Price) >= $4 (MC)
* Consumer Surplus: You get $3 of extra value ($10 - $7)
* Producer Surplus: The store gets $3 of extra value ($7 - $4)]
Producers have a Maximum Willingness to sell
Say their Maximum WTS is $3 but sold it for $10 then the difference between WTS and actual price sold for is the ____ ____ (PS) (Ps is $7 = $10 - $3)
The WTS is the ____ ____ (the cost of producing one extra)
WTS is connected to the marginal cost (cost of ____ __ ____ unit of that good)
WTS = MC
-Cost you something to produce an extra unit but if you are willing to sell then that means you probably covered that marginal cost. Because if you don’t then the business won’t last long. Example if it cost $2 to make and can only sell for $2.50 you lose money)
Rational if and only if MB greater than or equal to MC
[Often end up where the MB is = to MC]
Demand, decreases, increases, shift
ch 7 -Notes
Consumer Surplus Follows Law of ______:
P increases - CS ____
P decreases - CS ____
CS increases (good for you) if P-paid decreases
CS ↑ if P ↓
-because the difference between your WTP and Price you pay (which is CS) goes up
AKA if P-paid decrease → CS goes up
WTP - ↓ P-paid = ↑ CS
[example WTP $50, price decreases from $30 to $25 your CS increases from $20 to $25.]
CS decreases if P-Paid increases
CS ↓ if P ↑
Why? WTP - ↑ P-paid = ↓ CS
Why would the price change? Because of D and S curves ____
IRENT - DEmand
ITEND - SUPPLY
Price is not a shifter (move along the curve)
supply, increases, decreases, shift
ch 7 -Notes
Producer Surplus Follows Law of ______:
P increases - PS increases
P decreases - PS decreases
PS Increases if P-received increases
PS ↑ if P ↑
Why? WTS - ↑ P-received = ↑ PS
PS decreases if P-received decreases
PS ↓ if P ↓
Why? WTS - ↓ P-received = ↓ PS
Why would the price change? Because of D and S curves ____
IRENT - Demand
ITEND - SUPPLY
Price is not a shifter (move along the curve)
Supply, increased, decreases, increases, decreases, decreases, increases
ch 7 -Notes
If asked about the change in Consumer Surplus it means SUPPLY curve Shifted
CS? _____ curve shifted
Technology improves → this shifts the supply curve to right (increase)
CS before: A because P0 (so above P-paid and below D-curve)
CS after: ABC because P1 (so above the NEW P-paid and below D-curve)
What happened to CS? It ______ because Price ______
If supply decreases → P-paid ____ & PS ____
(shift left)
If supply increases → P-paid ____ & PS ____
(shift right)

Demand, increases, decreases, decreases, increases, increases
ch 7 -Notes
If asked about change in Producer Surplus it means DEMAND curve shifted
PS? _____ shifted
The good is inferior good and the income of buyers decreases → shifts D curve right because D of inferior good increases when income decreases
PS Before : B at P1 (below P-received and above S-curve)
PS After: BCD at P0 (below NEW P-received and above S-curve)
PS _____ because the P went up (good for producers) (Qs also goes up → law of supply)
If demand decreases → P-received _____ & PS _____
(shift left)
If demand increases → P-received _____ & PS _____
(shift right)
Total Surplus
ch 7 -Notes
_____ ______: is total sum of Consumer surplus (CS) and Producers Surplus (PS)
Add all the surpluses of consumers and producers = TS

sum
TS = Σ (WTP - WTS)
_____ of all the differences between Willingness to Pay (WTP) and willingness to sell (WTS)
demand, x, supply, x, positive, sum, WTP, WTS, WTP = WTS, same, nothing, greater, decrease, maximize, positives, greater than, equal, efficient, less, subtract, MB = MC, >, not, cost
ch 7 -Notes
For each unit such as P1: TS = WTP - WTS
Then TS = CS + PS
(GRAPH)
The WTP is from the _____ curve down to the X-axis (red line)
The WTS is from the _____ curve down to the X-Axis (blue dotted lines)
To get the TS you take each one (P1’s WTP-WTS) + (P2’s WTP-WS) all th way to Q*
Increase the Q then you get ____ numbers because WTP is GREATER than WTS
(WTP is from D-curve to X-axis so it covers more than WTS which is from S-curve to X-axis)
TS = Σ (WTP - WTS)
-Meaning ____ of all the differences between Willingness to Pay (____) and willingness to sell (____)
[Σ means sum of]
Once add all WTP - WTS together till you reach Q* what is true about Q*?
@Q* : ____ ___ _____ (there the _____)
-Meaning at Q* you add ____
-If you pass Q* → WTS will be _____ than WTP. You _____ your total surplus.
Is P*, Q* efficient? (without government intervention)
What it means by efficiency is Does it ____ total surplus (TS)? Yes
Because you are are adding ____ (WTP - WTS = positive number)
Produce a unit if: Its individual WTP ___ ____ or ___ to WTS (adds to surplus) as P*, Q* is _____. If WTP is ____ than WTS (____ from surplus) it's inefficient.
@P*, Q* : Are we rational? Yes
@P*, Q* : ____ = ____
But if you go further the MC ____ MB therefore not ____
{Note: Any ___ is an opportunity cost because you could be doing something else}
![<p>ch 7 -Notes</p><p><span style="background-color: transparent;">For each unit such as P1: TS = WTP - WTS</span></p><p><span style="background-color: transparent;">Then TS = CS + PS</span></p><p><span style="background-color: transparent;">(GRAPH)</span></p><p></p><p><span style="background-color: transparent;">The WTP is from the _____ curve down to the X-axis (red line)</span></p><p><span style="background-color: transparent;">The WTS is from the _____ curve down to the X-Axis (blue dotted lines)</span></p><p><span style="background-color: transparent;">To get the TS you take each one (P1’s WTP-WTS) + (P2’s WTP-WS) all th way to Q* </span></p><p><br></p><p><span style="background-color: transparent;">Increase the Q then you get ____ numbers because WTP is GREATER than WTS</span></p><p><span style="background-color: transparent;">(WTP is from D-curve to X-axis so it covers more than WTS which is from S-curve to X-axis)</span></p><p>TS = Σ (WTP - WTS)</p><p><span style="background-color: transparent;">-Meaning ____ of all the differences between Willingness to Pay (____) and willingness to sell (____)</span></p><p><span style="background-color: transparent;">[Σ means sum of]</span></p><p><span style="background-color: transparent;">Once add all WTP - WTS together till you reach Q* what is true about Q*?</span></p><p>@Q* : ____ ___ _____ (there the _____)</p><p><span style="background-color: transparent;">-Meaning at Q* you add ____ </span></p><p><span style="background-color: transparent;">-If you pass Q* → WTS will be _____ than WTP. You _____ your total surplus. </span></p><p></p><p>Is P*, Q* efficient? (without government intervention)</p><p>What it means by efficiency is Does it ____ total surplus (TS)? Yes</p><p><span style="background-color: transparent;">Because you are are adding </span>____<span style="background-color: transparent;"> (WTP - WTS = positive number)</span></p><p><span style="background-color: transparent;">Produce a unit if: Its individual WTP ___ ____ or ___ to WTS (adds to surplus) as P*, Q* is _____. If WTP is ____ than WTS (____ from surplus) it's inefficient. </span></p><p><br></p><p>@P*, Q* : Are we rational? Yes</p><p>@P*, Q* : ____ = ____</p><p>But if you go further the MC ____ MB therefore not ____ </p><p><br><br></p><p><span style="background-color: transparent;">{Note: Any ___ is an opportunity cost because you could be doing something else}</span></p>](https://assets.knowt.com/user-attachments/df310e7e-51c3-4c93-a9b7-f920fe5a9fc4.png)
same, PS, opposite, CS
If Demand shifts, P and Q move in the ____ direction. ____ moves in that same direction.
If P and Q increase = PS increases (Demand shifted right)
If P and Q decrease = PS decreases (Demand shifted left)
If Supply shifts, P and Q move in ____ directions. ____ moves in the opposite direction of price. Q and CS always move in the same direction.
If P decreases and Q increases = CS increases (Supply shifted right)
If P increases and Q decreases = CS decreases (Supply shifted left)