GIS Exam 1
 Call Kai
 Learn
Learn Practice Test
 Spaced Repetition
 Match
Match Flashcards
 Knowt Play
1/62

There's no tags or description
Looks like no tags are added yet.
Name | Mastery | Learn | Test | Matching | Spaced | Call with Kai | Chat |
|---|
No analytics yet
Send a link to your students to track their progress
63 Terms
File management
Maintaining a logical folder and file structure for your working files/folders and keeping all folders/files for one project in one place
Pathname
The file path that leads to where the file in question is located
Absolute pathname
The complete location of the file all the way to the file location of origin
Relative pathname
Where the file is with respect to the active working directory
Nest folders within folders
Create other folders within the main folders as the need arises
Qualitative data
Nominal or categorical data
Numerical data
Quantitative: interval and ratio
Nominal data
Names or uniquely identifies objects. Each feature is likely to have its own value. Usually portrayed on the map as labels
State names
Owner of parcels
Tax ID number
Parcel ID number
Categorical data
Names or describes objects. The data labels are categories. Data within a map may fall into a few groups or they may have as many values as featured
Hair color
Brown, blonde, black, red
Smoking status
Smoker or non-smoker
Ordinal data
A type of categorical data in which order is important though the interval between values is not constant
Class
Freshman, sophomore, junior, senior
Opinions about politics
Unhappy, neutral, happy
Comfort level
Cool, cold, freezing
Quantitative or Numeric data
Can be represented by using several different types of maps including graduated color or symbol, dot density, or chart maps. The ranking of the data is important. The type of data has number values like:
Population
Rainfall
Age
ACT score
Number of students in class
Discrete data
Measurement data where only certain values are possible. There is a gap between values
ACT scores
Number of caves in BG
Number of students in GIS316
Continuous data
Any value within an interval is possible with a fine enough measuring device. Typically use isoline maps
Elevation on a topographic map
Cholesterol over time
Temperature during a 24 hour period
Water temperature
Interval data
Data are spread along a regular scale of measurement units, like along a ruler or thermometer for measuring temperature. Measurement scales are expressed in equal number units, but do not have a true zero point
Achievement tests
Degrees
Ratio data
Measurement scales expressed in equal number units, but having a true zero point. Cannot be a negative number
Test scores
Salaries
Weight
Distances
Precipitation
Single symbol map
All of the features are drawn using the same symbol. This type of map is used to show the size, shape and location of the features

Nominal maps
Assign a different color to every unique value in a field

Quantities maps
Symbols in a quantities map represent a range of numeric values, like population. These maps usually show interval and ratio data and may also be used to display ordinal data

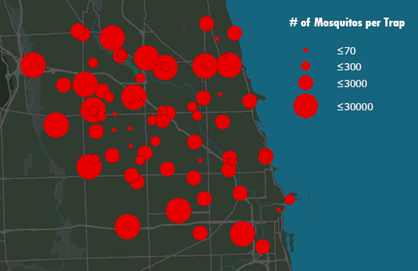
Graduated symbol maps
Group data into distinct classes and represent each class with a different sized symbol
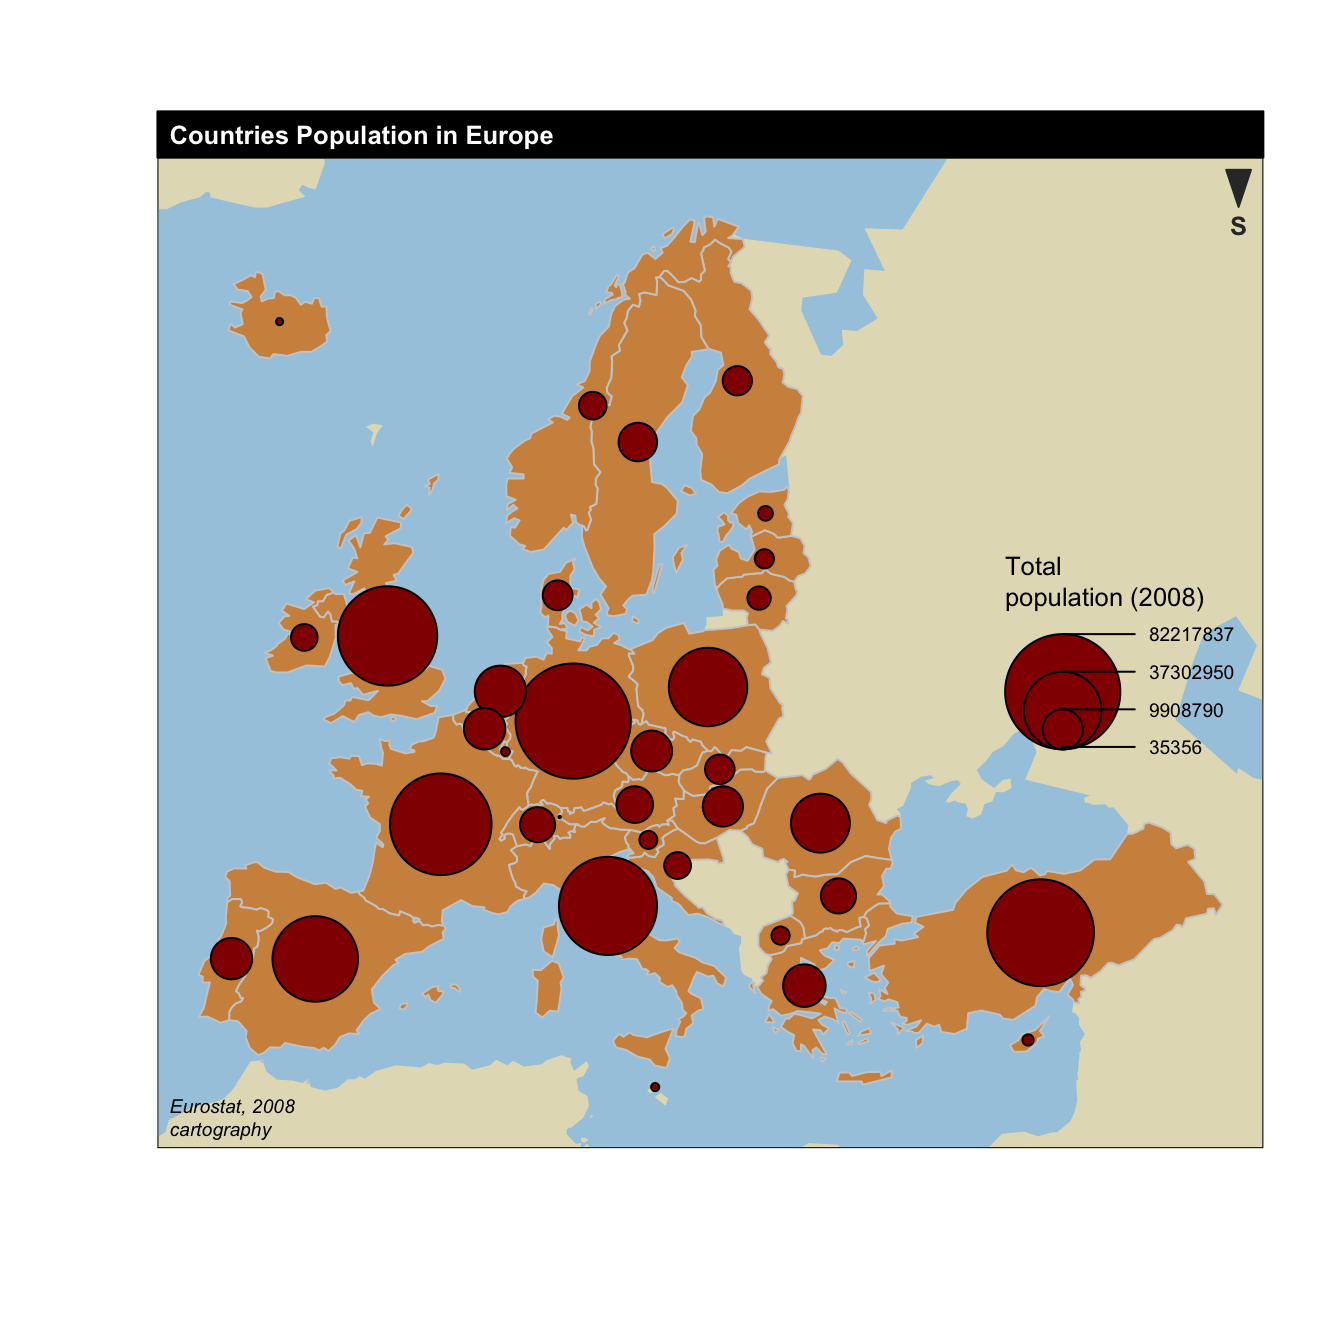
Proportional symbol map
Directly scales the size of each symbol based on the exact value of the data at each location without grouping classes
Dot density maps
Visually represents the geographic distribution of a phenomenon by placing dots on a map, where each dot represents a specific quantity of that phenomenon

Isarithmic map
A thematic map that uses lines to connect points of equal value for a continuous phenomenon

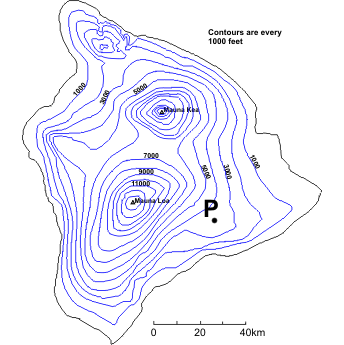
Contour map
A map connecting lines of qual physical election. Used to map physical geographical height and depth.
Spheroid
A three-dimensional solid in which all points on the surface are the same distance from the center. Used to approximate the true shape and size of the earth. In GIS this term and ellipsoid are used interchangeably
Map units
The actual units used in the measuring (meters or imperial)
Extent
The range of the x-y values
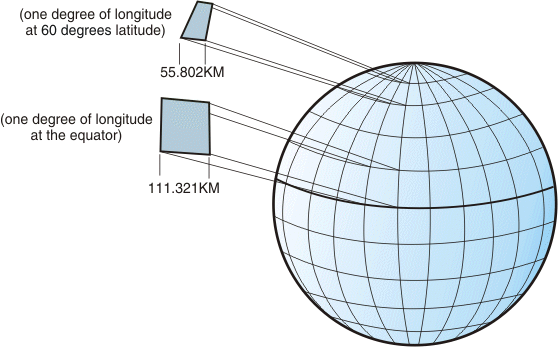
Unprojected (Geographic coordinate system GCS)
Based on spherical globe coordinates. Uses degrees of latitude and longitude
Projected
Converts spherical coordinates to planar coordinates. Set of mathematical equations. Projects 3D coordinates to 2D map

Latitude
Measures the angle from the horizontal. It represents north-south distance from the equator
Longitude
Measures around the circle of the equatorial plane. It represents east-west distance from Prime Meridian
Standard parallel
A specific line of latitude on a map projection where the scale is completely true and free of distortion
Tangent projection
Touches the globe at a single line, giving it one standard parallel
Secant projection
Slices through the globe at two lines, giving it two standard parallels
Prime Meridian
The imaginary north-south line that defines zero degrees longitude, dividing the Earth into the Eastern and Western hemispheres. Longitude is zero
Central meridian
An imaginary line of longitude that defines the center and serves and the starting point for horizontal measurements in a map projection or coordinate system

Normalizing data
Converting raw value into a proportion, rate, or ratio by diving it by some other relevant quantity, usually total population, total area, or another baseline count so that values become comparable across units of different size
Classified map
Values grouped into a set number of discrete classes (e.g. 4-6 bins). Limited number of distinct colors
Unclassified map
Every unique value gets its own shade, no grouping
Project tool
Converts a dataset’s coordinates from one spatial reference to another, producing a new output feature class, feature dataset, or raster
Developable surface
A geometric form capable of being flattened without stretching or tearing, such as cylinder or cone, and a plane
Graticule
The intersection of latitude and longitude lines make a graticule
Large scale map
A map that shows a relatively small area with a high level of detail
Small scale map
Map that shows a large geographical area with less detail, meaning it covers a wider region but its features are depicted with less precision.
Projection
The process of projecting the earth onto a flat surface
Distance (equidistance)
Whether the map preserves true distances, but only along certain lines, usually from one or two central points or along particular meridians. Used when the primary concern is accurately measuring distances from a specific point or along specific lines
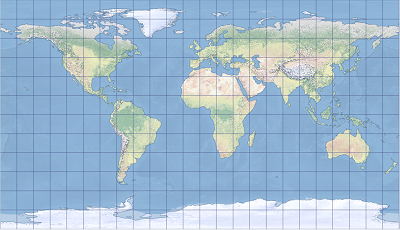
Area (equivalence)
Whether regions maintain their correct relative size. An equal are projection like Albers or Mollweide preserves area accurately, which matters a lot for thematic mapping

Direction (Azimuthal)
Whether bearings/directions from a point are shown correctly. Preserve direction from one central point outward, which is useful for things like flight paths, or seismic/radio proportion maps
Shape (conformality)
How well angles and local shapes are preserved. A projection like this like Mercator keeps small shapes looking correct, which is why it’s still used for navigation, a straight line on the map is a straight compass bearing
Class
The overall shape and appearance of the graticule after the projection process is complete. Three classes are cylindrical, conic and planar
Cylindrical class
Wrapping developable surface around a cylinder, projecting the graticule, then unrolling the cylinder

Conic class
Results from wrapping the developable surface around a cone, projecting the landmasses and graticule on the cone, then unrolling the cone

Planar class (or azimuthal)
Results from positioning the developable surface of a plane next to the reference globe and projecting the landmasses and graticule onto the plane

Secant case
The developable surface passes through the reference globe
Aspect
Deals with the placement of the projection’s center with respect to the Earth’s surface
Equatorial
Centered somewhere along the equator
Oblique
Centered somewhere between the poles and the equator
Polar
Centered at one of the poles
Transverse aspect
Means the projection surface is rotated 90 degrees from normal
Tissot’s Indicatrix
Provides a graphical representation of distortion at various places across a projection

Equidistant projections
These maintain the principal scale from two points on the map to any other point on the map
Conformal projections
These preserve the angular relationships around a point by uniformly preserving scale relations about that point in all directions

Azumithal projections
Directions are preserved from the center of the map to any other point on the map in these types of projections
Compromise projections
Do not preserve any specific property