BIOL-141L Midterm Study Guide
 Call Kai
 Learn
Learn Practice Test
 Spaced Repetition
 Match
Match Flashcards
 Knowt Play
1/127

There's no tags or description
Looks like no tags are added yet.
Name | Mastery | Learn | Test | Matching | Spaced | Call with Kai | Chat |
|---|
No analytics yet
Send a link to your students to track their progress
128 Terms
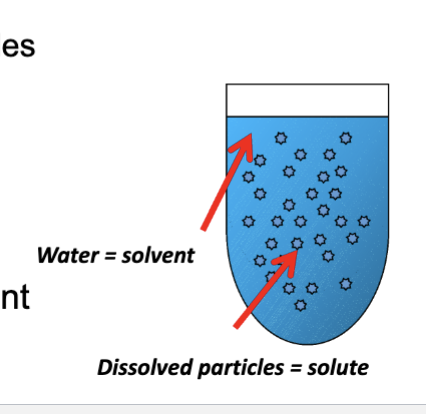
solution
a homogenous mixture of one substance (the solute) dissolved in another substance (the solvent)
solvent
water or other dissolving agents
solute
dissolved particles (chemicals, sugar, salt, dye)
concentration of a solution
reflects a ratio of the amount of solute to the amount of solvent
Dilution
the process of reducing the concentration of a solute in a solution by mixing it with more solvent.
the solute/solvent ratio decreases because the volume of solvent increases
many commercially available solutions are provided as _ (_) _ and need to be _ to _ _ prior to use
concentrated (stock) solution, diluted, lower concentration
Formula to determine how much stock to use and what each variable stands for
V1 C1 = V2 C2
V1 = starting volume of concentrated (stock) solution needed to make the diluted (new) solution
C1 = starting concentration of concentrated (stock) solution
V2 = final volume of diluted (new, working) solution
C2 = final concentration of diluted (new, working) solution
Formula for determining how much water (or other solvent) to add
V solvent = V2 - V1
Dilution factor (DF)
Represents how much the concentration of solute has decreased in the diluted concentration from the stock
Dilution factor formula
DF = V1/V2 = V1/V1+V solvent = Starting volume of stock/(Starting volume of stock + Volume of solvent)
Serial dilutions
Preparation of successive dilutions
Vary the concentration of the solute by a constant factor
Each successive dilution is a multiple of the previous dilution
How to find the final dilution factor in the last cup (from the stock) in a serial dilution:
Multiplying the dilution factors of each solution
Ex: DF1 = 1/10, DF2 = 1/10
Final DF = 1/10 × 1/10 = 1/100
Dilution factors have no units as they cancel out!
How is the total volume in serial dilutions distributed?
Each tube usually has 9mL (or whatever unit) of volume, while the transferred volume from each tube is 1mL (or whatever unit).

Dilution factor/Final concentration table example
Serial dilution diagram/drawing example

** The concentration in each dilution tube is _ on the _ _ of the _ !
+ example
dependent;original concentration;stock
Example: If you started with a 10M NaCl stock concentration instead of a 1M stock concentration, tube A would have a 1M NaCl concentration, tube B would have a 0.1 M (10-1) NaCl concentration, and so on.
The dilution factors would be the same if all were 1/10 dilutions, but the concentrations would be different. This concept is very important to know.
General lab safety guidelines
long pants/skirts and closed-toe shoes during lab
clothes should fully cover the stomach
no food or drink allowed in classroom
follow/ask instructor for any directions/disposal directions
no druggies (against law)
store materials in cubby prior to lab
masks wearing is the student’s choice
gloves on as soon as u enter and they go in the TRASH
no excessively long nails
students can request goggles
ur materials bin is shared with one lab partner (or two if odd number)
must use disinfectant solution provided to spray down lab station before AND after each lab
use alcohol pads to wipe down microscope if it is being used
do not remove any chemicals or organisms or materials from the lab
know the locations of the chemical waste disposal container, glass waste bin, biohazard disposal bin, first aid kit, fire extinguisher, eye wash basin, and shower.
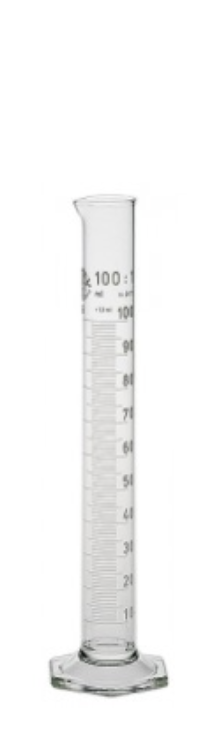
Graduated cylinders (what is it used for, how is volume measured)
Used to measure volumes of liquids in the mL range
Due to surface tension (adhesive properties), the surface of the water takes a concave shape
Volume is measured by reading the bottom of the meniscus line
Plastic cylinders don’t usually have as prominent a meniscus as the glass ones
10mL graduated cylinder (how to read it)
Each line represents 0.1 (9-liner) mL or 0.2 mL (4-liner) volumes (depends on the cylinder)
1 or 2 mL increments have large numbers to indicated volume (depends on the cylinder)
100mL graduated cylinder (how to read it)
Each line represents 1 mL volume with slightly larger lines that represent every 5 mL
10mL increments have large numbers to indicate the volume
Serological pipettes (used for what; common pipette sizes)
Used to more accurately transfer volumes of liquids and can measure volumes from 1-25 mL
Common pipette sizes: 1mL, 5mL, 10mL, 25mL
Need to use a pipetting aid/pump to draw up and dispense the liquid
How to read a 10mL serological pipette
Each pipette has large numbers running from 9 to 0 (bottom to top) that each represent 1 mL volumes
Often, they have smaller numbers in the opposite order on the other side
Smaller lines represent every 0.1 mL volume

Rules for pipetting (5): Serological pipette
Draw up and dispense the liquid slowly
If air bubbles appear, while drawing the liquid into the pipette, dispense the liquid and do it again
Do NOT let the liquid go up into the cotton, it will prevent the pipette from working
If there is liquid in the pipette, do not place it down on the counter or hold it upside down
Always double check your volume after removing the tip from water (will often drop)
Micropipettes (used for what)
Used to measure microliter volumes of liquid from 0.1 to 1000 μL (≤ 1 mL)
Used with disposable pipet tips
Each measures volumes in a specific range
Micropipettes (Common pipettes and HOW to read the volumes)
P-1000: for 100-1000 μl
P-200: for 20-100 μl
P-100: for 10-100 μl
P-20: for 2-20 μl
P-10: for 1-10 μl
Look at number of boxes on pipettes and whether there is a decimal point on them or not!!

Reading volumes on dif. types of micropipettes: Values in between integers
Each smaller line gives one extra unit of measurement
Line increments by pipette type:
P-20: every 0.02 μl (0.02, 0.04, 0.06, 0.08)
P-200: every 0.2 μl (0.2, 0.4, 0.6, 0.8)
P-1000: every 1 μl → last unit big number is either 0 or 5

For pipettes read vertically, a reading of “015” means:
150 μl on a P-1000
15.0 μl on a P-100/P-200
1.50 μl on a P-10/P-20
Micropipette use: Drawing up the liquid steps
1: Twist plunger/dial to desired volume
2: Add disposable pipette tip
3: Press plunger to first stop
4: To draw the water up, put the tip into the water
5: Slowly release plunger to go back to the rest position
Pause for a moment to make sure all of the liquid has been drawn up

Micropipette use: Dispensing the liquid
1: Pull the pipette straight out of the tube
Make sure there is no bubbles
2: Move the pipette to the empty tube
3: To dispense liquid, press plunger (SLOWLY) past first stop to second stop
Touch the side of the tube (it is difficult to dispense the liquid in the air)
4: Keep plunger down as you remove the pipette
5: Eject tip: Push the tip eject button

Rules for pipetting: Micropipette
Never use a pipette without a tip on it
Never lay down or turn upside down a pipette that has a tip filled with liquid
Never rotate the volume adjuster beyond the upper / lower range of the pipette
ALL OF THESE MISUSES CAN DAMAGE THE PIPETTE
Digital scales (solid measurements) buttons’ meaning:
ZERO: used to tare the balance as well as turn the power on or off
UNIT: used to change the unit of mass you want to measure
Physical quantities in science are expressed using _ units and using the _ system.
SI (International System of Measurements); Metric

SI Units chart (Property, Unit, Symbol)
→ also Property: volume, Unit: liters, Symbol: L
Prefixes for Metric system (Prefix, Symbol, Base unit multiplied by…, Example)

Conversion rates!!
1 km = 1,000 m
1 m = 1,000 mm
1 m = 100 cm
1 m = 1,000,000 μm
1 m = 1,000,000,000 nm
1 m = 10 dm
MAKE SURE THE STARTING UNIT ALWAYS CANCELS OUT IN DIMENSIONAL ANALYSIS!!
Scientific notation
Useful way to express very large or very small numbers
ex: Avogadro’s number: 6.02 × 10²³ m
Scientific notation: numbers less than 1
Move the decimal rightward to the first digit and count the number of places

Scientific notation: numbers more than 1
Move the decimal leftward to the first digit and count the number of places

Conversion rate between two dif. units FORMULA
value you are starting with * (conversion rate of the unit you want to end up with) / (conversion rate value of the same unit you are starting with) = value with the unit you want to end up with
Molarity formula (and corresponding moles of solute formula)
Molarity (M or mol/L) = Moles of solute / Volume of solution in Liters
Moles of solute: mass of solute (g) in given problem / molar mass of solute (g/mol) → g cancels out, leaving us with mol!
Molarity: one step approach (Formula to solve for mass of solute needed to make a solution)
number of grams solute = molar mass * desired molarity * desired volume (L)
Molarity: two step approach
1) solve for moles of solute using molarity equation → Rearrange equation to solve for moles → moles = Molarity * volume (L)
2) solve for mass of solute using molar mass conversion → moles solute * (molar mass solute (g) ) / 1 mol solute = mass (g) of solute to weigh out
How to properly dilute without overshooting volume
1) add less than needed volume of solvent to beaker/cylinder
2) add solute and mix
3) slowly add more solvent until expected volume is reached, then mix
Water can dissolve _ _ _/_ because it is a _ _.
polar covalent molecules/ions ; polar molecule
Polar covalent solutes (and examples)
Dissolve by separating into individual molecules and forming hydrogen bonds with water
Ex: simple sugars like glucose
Ionic solutes (and examples)
Dissociate into fully-charged ions (ex: NaCl: Na+, Cl-), held in solutions by electrostatic/ionic interactions in water
Electrolytes (+ examples)
Solutions containing free ions that can conduct electricity
Ex: Gatorade, body fluids
Conductivity rule
The more ions in a solution, the higher its electrical conductivity
What does pH measure?
Acidity and alkalinity based on hydrogen ion concentration or [H+] ← brackets represent concentration
pH formula
-log10[H+]
[H+] is the molar concentration of hydrogen ions
Hydroxide ion
[OH-]
higher hydroxide ion concentration in a solution means it is more basic, and higher hydrogen ion concentration in a solution means it is more acidic
DI / Deionized water
Filtered to remove ions, but atmospheric CO2 dissolves in it to form H+ ions over time, which affects its pH and conductivity
Acidic pH
pH < 7 ( [H+] > [OH-] )
Basic pH
pH > 7 ( [OH-] > [H+] )
Neutral pH
pH = 7 ( [OH-] = [H+] )
at any pH, the logarithmic sum of concentrations is…
14
log[H+] + log[OH-] = 14
How to calculate pH from [H+]
pH = -log[H+]
How to calculate [H+] from pH
[H+] = 10-pH
An example of a strong acid is _ because it…
An example of a weak acid is _ because it…
HCl (hydrochloric acid); completely dissociates (ionizes) into H+ and Cl- ions, lowering the pH.
H2CO3 (carbonic acid) ; only partially dissociates (ionizes) into ions (H+ and HCO3-), not lowering the pH but instead slightly raising it.
An example of a strong base is _ because it…
An example of a weak base is _ because it…
NaOH (sodium hydroxide) ; completely dissociates into Na+ and OH- ions, raising the pH.
NH3 (ammonia) ; only partially ionizes in water to form OH- ions, not raising the pH but instead slightly lowering it.
A 1-unit increase in pH = a _-_ _ in [H+].
10-fold decrease
Vice versa, a 1-unit decrease in pH = a 10-fold increase in [H+].
Buffers
Chemicals that react with H+ or OH- to resist changes in pH.
By diluting HCl (a strong acid) in water, the pH of the solution should _, by diluting NaOH (a strong base) in water, the pH of the solution should _.
increase ; decrease
If the conductivity meter lights both the green and red lights considerably, this means that the solution has _ conductivity and there is a _ concentration of ions present in the solution.
high ; high
High conductivity is typically associated with _ bonds, while low conductivity is typically associated with _ bonds and _ forces.
ionic ; hydrogen ; intramolecular
Ions do not dissociate from glucose when it is dissolved in water because _, and thus it has _ conductivity.
Glucose (C6H12O6) is held together by strong covalent bonds rather than ionic bonds, and instead forms hydrogen bonds with water (H2O) molecules without any ionization occuring. ; low
Diluting any aqueous solution with DI (Deionized) water moves its pH closer to the pH of _ _ which is _.
Pure water ; neutral (~7, although the pH of pure DI exposed to air is ~ 5-6).
Monosaccharides (reducing sugars): reagent and test
Benedict’s solution
Solution heated for 3-5 mins in boiling water
Positive test: Monosaccharides (simple carbohydrates, reducing sugars)
Color gradient change from light blue/green → yellow → orange → brick red
The more the color changes, the more abundant the solution is in monosaccharides
Negative test: Monosaccharides (simple carbohydrates, reducing sugars)
Solution remains a light blue/green
Starch (polysaccharide, complex carbohydrate): reagent and test
Iodine dye
Solution shaken for 30 seconds after complete addition of solvent/all solutes
Positive test: Starch (complex carb.)
Dark blue solution
Negative test: Starch (complex carb.)
Bright yellow solution
Lipids: reagent and test
Sudan IV dye
Solution shaken for 30 seconds after complete addition of solvent & all solutes; look at the meniscus
Positive test: Lipids
Concentrated scarlet red droplets at meniscus, reddish solution
Negative test: Lipids
Solution is a uniform pink
Proteins (Biuret test): reagents and procedure
Sodium hydroxide (NaOH; added first to ensure the peptide bonds in the proteins lose hydrogen atoms) and copper sulfate (CuSO4)
Solution shaken for 30 seconds after complete addition of solvent & all solutes; let precipitate settle before reading
Positive test: Proteins
Solution is a violet/purple liquid above the precipitate
Negative test: Proteins
Solution is clear above the precipitate
Vitamin C (ascorbic acid)/citric acid: reagent and test
Indophenol dye
Added drop-by-drop, and the test tube is shaken after each drop
Positive test: Vitamin C/citric acid
Color gradient change: Dark blue → transparent + colorless
The more the color gradient changes, the more abundant vitamin C is in the solution
Negative test: Vitamin C/citric acid
No color gradient change, with the solution remaining a dark blue
Positive control
Produces a known and expected result; and proves that the experimental setup is able to produce a measurable outcome; prevents false negatives
Negative control
No response expected; uses solvent/placebo like water; prevents false positives
Scientific process order
Observation → question → hypothesis/explanation → prediction → experiment → results → analysis/conclusion → peer review
Observation
Objective info gathered directly from senses
Hypothesis
A tentative, testable, falsifiable explanation for the scientific observation or phenomenon
Prediction
An expected outcome of a specific test if the hypothesis is true, usually in the form of an “If...Then…” statement
Independent variable
The factor intentionally changed / manipulated by the experimenter
Plotted on X-axis
Dependent variable
The factor being measured / observed that changes in response to the independent variable
Plotted on Y-axis
Experimental group
The group receiving the treatment/manipulation
Control group
The baseline group kept under normal conditions (given a placebo / not given the treatment or manipulation) to compare results
Controlled variables (Constants)
Factors kept strictly identical across all groups to isolate the independent variable’s effect

Line graph
Shows continuous change over time

Scatter plot (Study image!!)
Displays the relationship / correlation between two continuous variables


Scatter plot: positive correlation
As the x-variable increases, the y-variable also increases

Scatter plot: negative correlation
As the x-variable increases, the y-variable decreases

Bar graph
Compares distinct categories/discrete groups

Pie chart
Shows proportions / percentages of a whole
Linear graph relationships
The rate of change between variables is constant, producing a straight line (y = mx + b)
Non-linear graph relationships
The rate of change varies, resulting in a curved line (e.g., exponential growth)
Quantitative graph descriptions
Describing data trends using specific numeral values and rates rather than vague descriptions
Ex: "As temperature increased from 20°C to 40°C, reaction rate doubled from 2.5 g/s to 5.0 g/s," rather than "Reaction rate went up."