BILD 5: MIDTERM 1
 Call Kai
 Learn
 Practice Test
 Spaced Repetition
 Match
 Flashcards
 Knowt Play
1/55

Earn XP
Description and Tags
categorical
56 Terms
identify: in the context of R, identify fxn of $ (operator)
serves to extract specific columns/components of a large, complex data set.
identify: in the context of R, names of columns & rows
columns; variables. row; observation.
define: in the context of R, what’s an object?
a stored value/data structure that can be manipulated/analyzed/reused.
identify: in the context of R, what are the allowed characters to name an object? (letters, digits, punctuation [2]?)
letters A-Z, digits 0-9, the period, and the underscore
identify: in the context of R, what are the three conventions of naming an object?
name must begin with a letter, no spaces, case-sensitive
define: in the context of R, define the fxn of print()
outputs text of an object
define: in the context of R, define the fxn of c()
creates list (vector)
define: in the context of R, define the fxn of userinfo()
runs a background check on the person using the computer
define: in the context of R, define the fxn of mean()
returns sample mean
define: in the context of R, define the fxn of runif()
returns a random number
define: in the context of R, define the fxn of str()
summarizes a data set
define: in the context of R, define the fxn of boxplot()
draws a box-and-whisker plot
define: numerical data
expressed in numbers
define: categorical data
observations sorted into groups.
define: core bias
treating one study as whole, accurate representation for one population
identify: amplifiers of core bias (4)
authority bias, illusion of explanatory depth, black-and-white thinking, confirmation bias
define: anchoring bias
over reliance on the first piece of information recieved “anchor”, which serves as a baseline of future comparison & judgment
define: dunnning-kruger effect
dumb people overestimate their intelligence and skill
define: PPDAC (investigative cycle)
problem, plan, data, analysis, conclusion
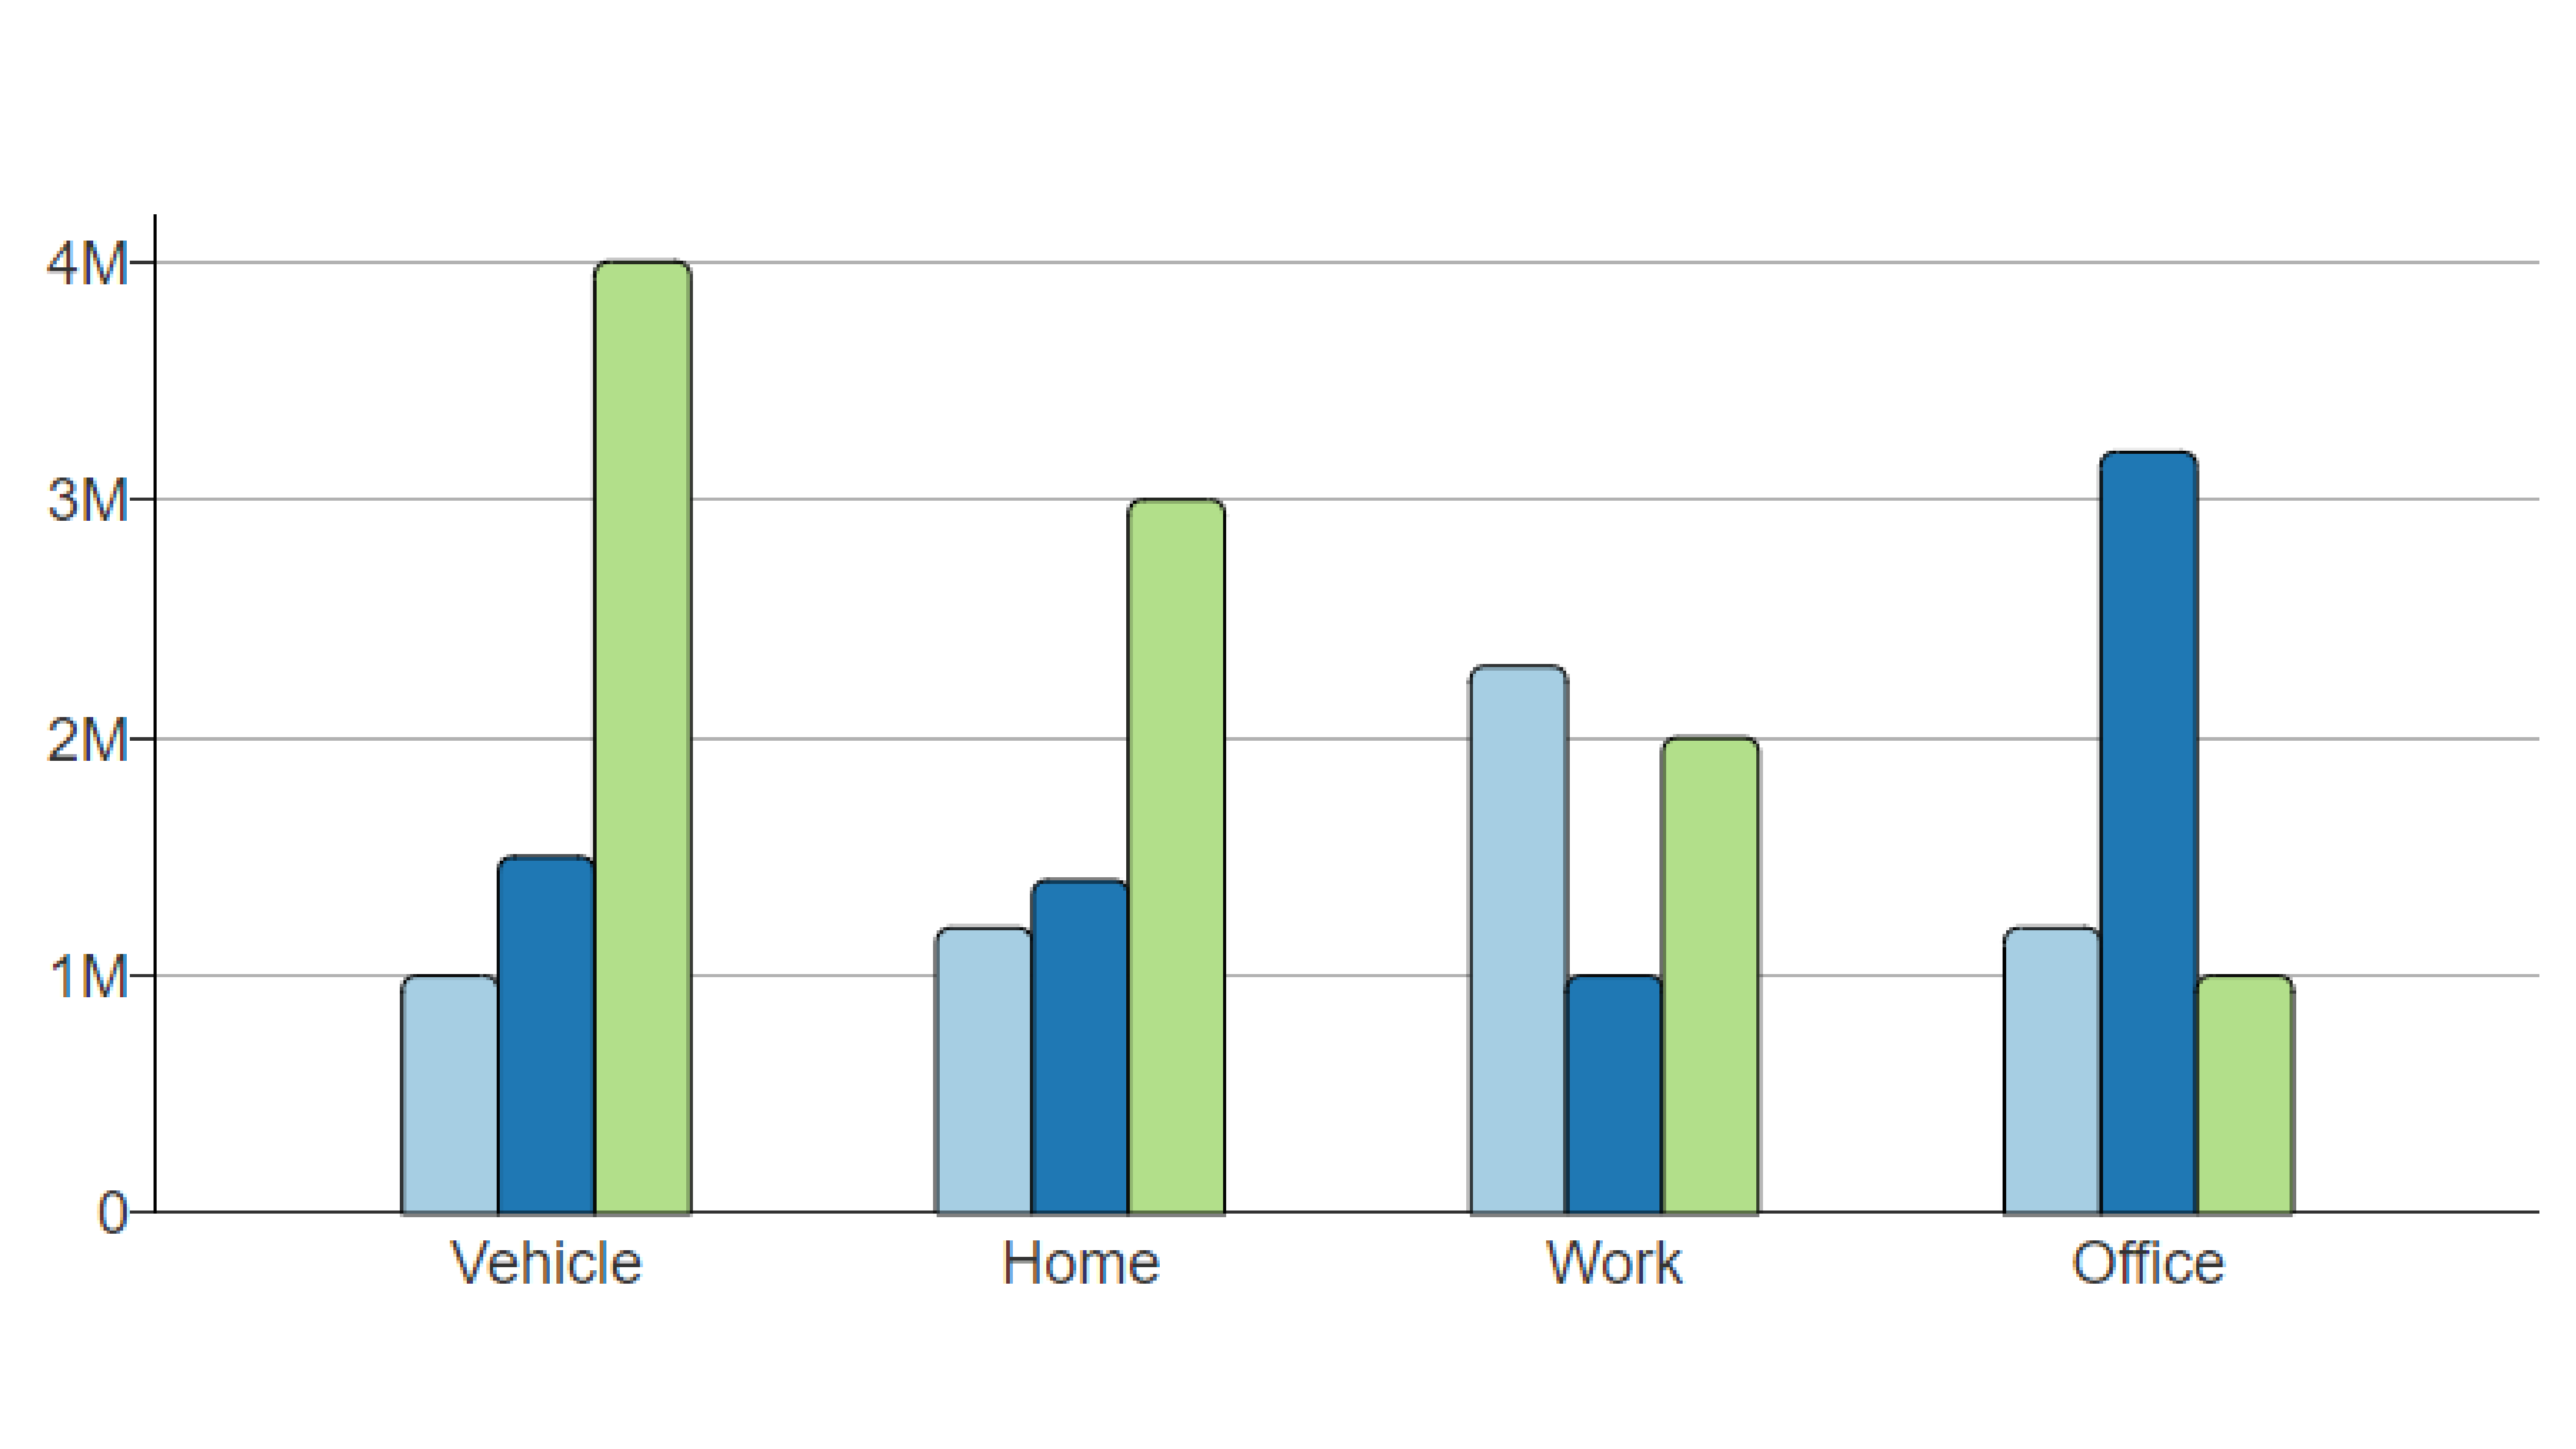
define: bar plot
one continuous variable +

define: scatterplot
relationship between two continuous variables

define: line graph
relationship between two continuous variables; usually one variable is ordered

define: histogram
distribution of one continuous variable

define: box plots
Shows the distribution of numerical data using quartiles, median, and potential outliers.
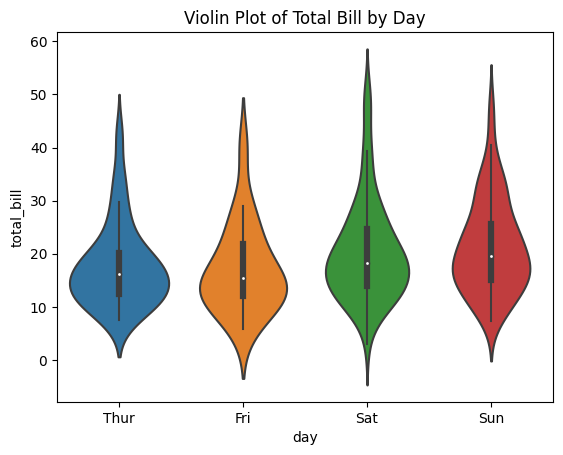
define: violin plots
Shows the distribution of numerical data across categorical groups.
define: ordinal data
ex: order of higher education certifications
categorical data with meaningful order
identify: types of numerical data
continuous, count
identify: types of categorical data
ordinal, binomial
define: continuous data (NUMERICAL)
a measurement that can take any value within a range
define: count data (NUMERICAL)
a number representing how many of something there is
define: binomial data (non numerical)
a category with two different outcomes
define: median
average
define: median
middle of all ranked values
define: mode
the most common value
define: robust
an overall measure being resilient— less susceptible to change because of outliers
define: central limit theorem
the distribution of a sample mean approaches a normal distribution as sample size increases, regardless of the original shape of the original population distribution.
define: standard error of mean
measures how much a sample mean is expected to vary from the true population mean
define: standard deviation
measure of how much the values in the data set deviate from the mean
define: negative control
sample treated with factor known to produce no effect
define: positive control
sample treated with a factor known to produce a specific, expected outcomed
define: p-value
probability of observing an effect– or something more extreme– under the null hypothesis
define: signal
observed component which carries significance as to understanding the true underlying pattern
define: noise
amount of variation between groups
define: z-score
measures how many standard deviations a data point is from the mean
define: t-score
measures how many estimate errors a sample ean is away from a hypothesized population mean
define: chi-square statistic
does the observed data match an expected distribution?
define: R command for the mean of a colum
mean(data$column)
define: IQR
Q3-Q1, spread of the middle 50% of observations
define: 95% confidence interval
range of numbers that is likely to contain the true population value
so if you ran this experiment 100 times, 95 of them would successfully capture the true population
define: power
the probability of correctly detecting a real effect
define: power equation
1 - beta, beta = the probability of a type II error (false negative)
define: effect size
a measure of how prominent a difference is between groups and/or variables
define: alpha
the significance threshold chosen before a hypothesis test (p = 0.05)
define: type I error
false positive; a test detects an effect that doesn’t actually exist— rejecting the null.
define: type II error
false negative; test fails to detect effect that actually exists— failing to reject a false null hypothesis
what constitutes tidy data?
each variable is a column, each observation is a row, and each value is a cell